


February 23rd, 2023
Multiple bearish patterns throughout

Yesterday after market close we noticed a dark pool dump transaction at 407.22. We now have confirmed dark pool dumps (large sellers) at 416.72, 415.20 and 407.22. These levels will serve as significant resistance points if revisited. If we revisit this 407.22 level on a relief bounce - that's likely where the relief bounce ends.
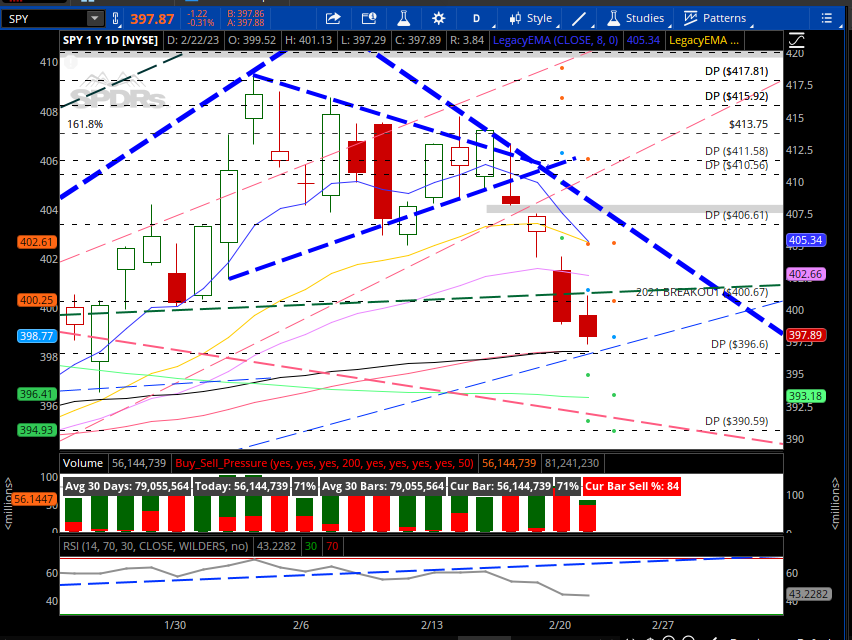
SPY has broken out of this triangle to the downside (initially with a gravestone doji) that has been confirmed. SPY has not traded above the 8ema now since 2/16 and the 8ema is now curling down, crossing over the 21ema indicating that momentum in the short term has shifted to the downside. 396.60 is immediately below, a fib level and also where the 50SMA sits. It’s possible for us to see some tight range action here between 396.60 and 406.60 until we can manage a close below 396.60 or above 406.61 (keep in mind the 407.22 dp sell level).
I mentioned months ago that SPY 0.00%↑ appeared to be making a 2B top pattern and i’ll demonstrate here how that is the same exact pattern that is building out, it just took several months to develop:
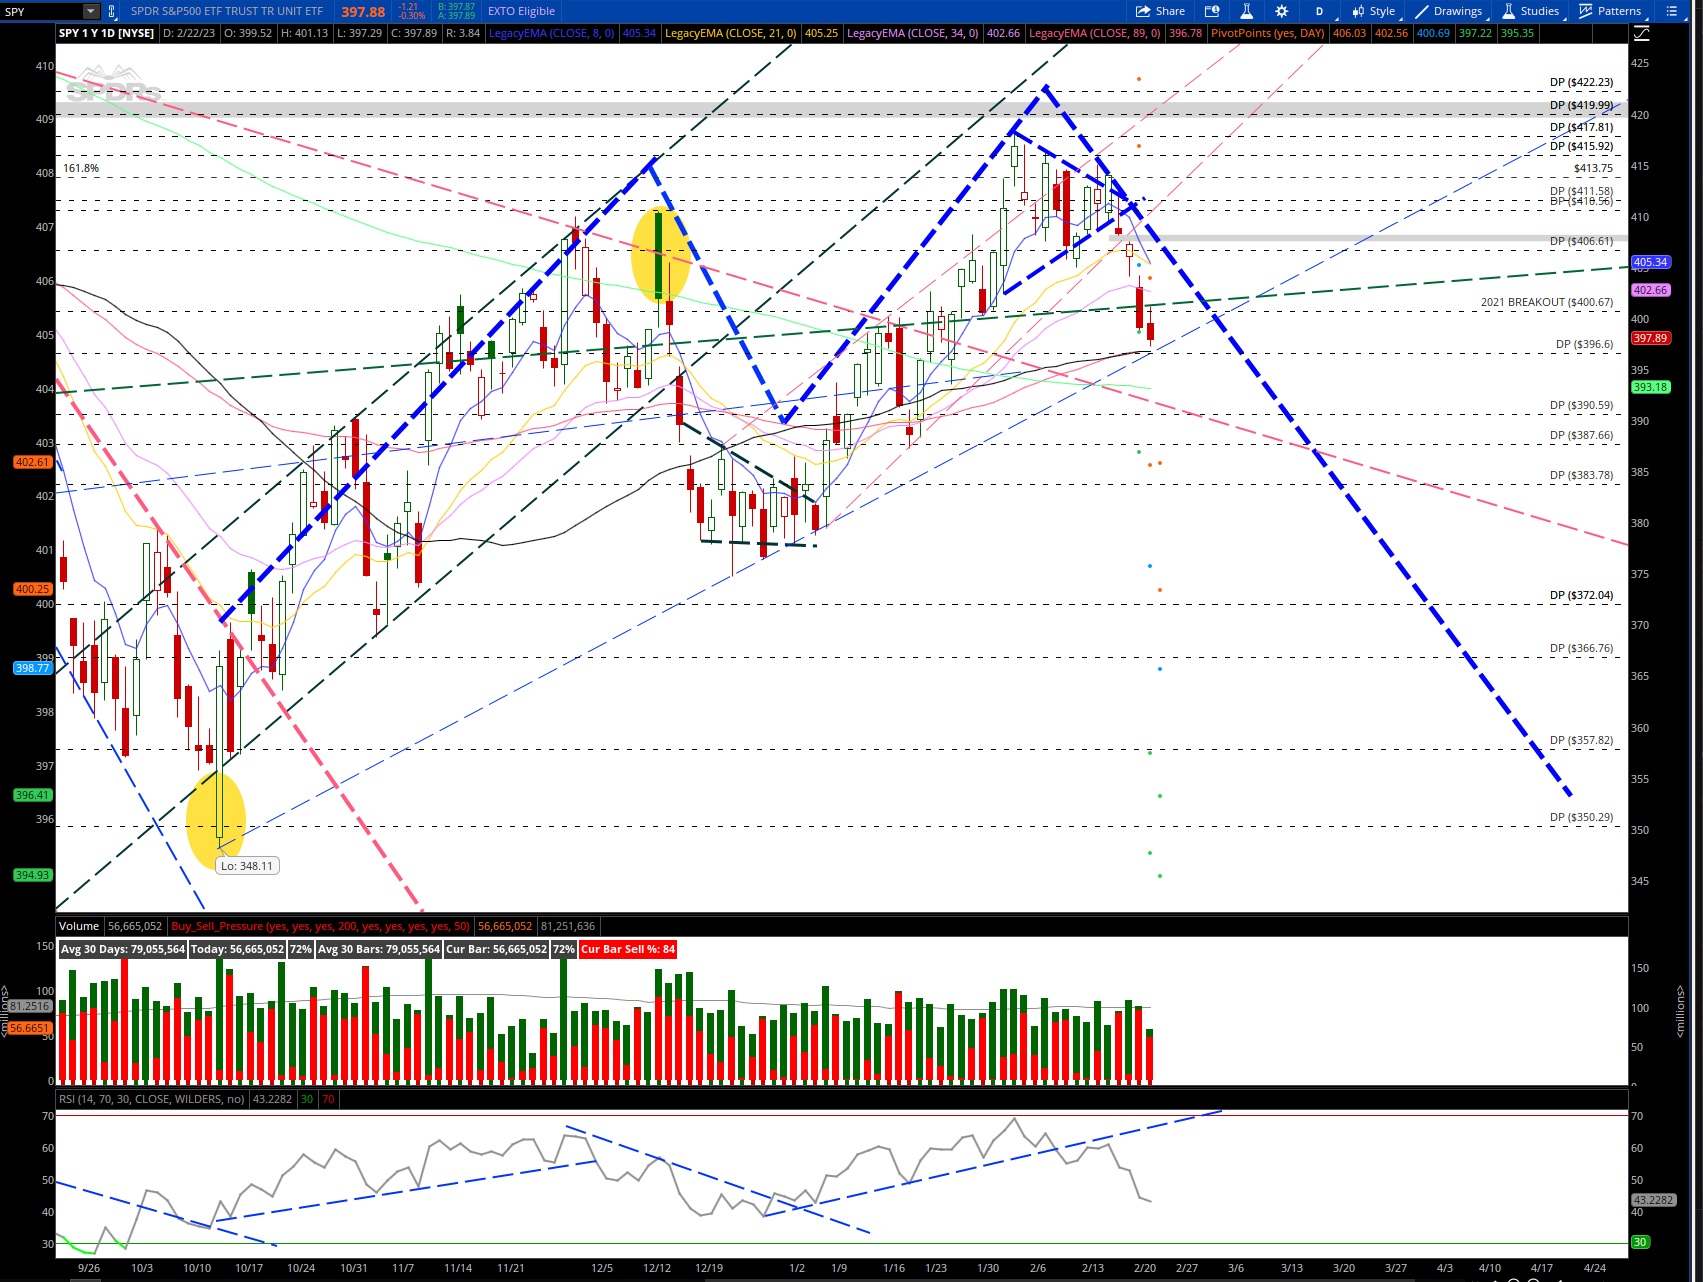
Essentially this pattern suggest a revisit to the 200sma (at the same spot as bear market/downtrend line, which will then determine if we are to revisit October lows and fulfill this 2B top pattern, or if we maintain bullish momentum. IMO this structure is overwhelmingly bearish and mimicks a “suckers rally”.
We will continue to take it day by day and watch the orderflow. I’ve noticed TSLA 0.00%↑ and NVDA 0.00%↑ have been good indicators for direction. TSLA er sparked bullish upside in markets and have gotten us this far. NVDA ER is coming up after the close and can set the tone for the weeks to come.
Here is the economic calendar for tomorrow:

And these are the levels I will be watching for tomorrow.
SPY 0.00%↑
Looking for a D1 close and subsequent open below 396.60 for a move down into 393.18, where we would see the backtest of the downtrend line from ATH.
396.60 pivot.
→ Above pivot we can see relief bounce towards 406.61 but should be capped at 407.22.
→ Below pivot we can see backtest of 200sma and bear/downtrend line at 393.18
AAPL 0.00%↑
148.33 pivot
→ Below pivot target 200sma at 147.31, fib at 146.62
→ Above pivot target retest at 151.30, 151.74

TSLA 0.00%↑
198.02 pivot
→ Below pivot target 190, 186.17
→ Above pivot target 201.35, 204
Note*** The potential 2B TOP / double top pattern here can be invalidated on a close above 204 / move over 210

Will send out updates in the discord.
-Jovan