

Week of February 6th, 2023
Battle of 4095 - Do bulls hold the breakout, or do we get a multi-day sell?

$ES_F / SPY / SPX
Pressure has been on for the bears these past 2 weeks as SPY broke out over the 200SMA and now has had 11 daily closes over it. This has - in the past - marked the bottom of a bear market if we're comparing to 2008 and 2020. However... that is all part of the game MM play. We cannot drop when everyone expects a drop (in 2008 people were caught off guard as they thought it was an impossibility for the banks to fail and we didn't have as much retail trading volume as we do today. In 2020 we were also caught off guard because of the uncertainty of COVID, lockdowns, etc), and that's why back at 380, I outlined a path to 400. Then we saw some 400c, 405c, and 410c flow come in for 2/10, as we were dropping and doing a backtest. I expected 406-410. I did not plan for 420 quite frankly, however all in all the higher we go the bigger the potential reward on a short as well as the easier it gets to take a short position. You can see the ridiculous bull euphoria, extreme greed, the total dismissal of any actual issues with the macros even though Powell gave all the hints he needed to give. I've never really seen an easier trade setup, R:R wise for the issues that are about to unfold this year. The only issue you can run into is - TIME - due to the nature of options.
I am convinced that this has all been a great design in a sense to squeeze out all the bears, cause bears/bulls to consider possibility of new highs no matter what ("nothing is stopping this market from going up") and to take "recession", " inflation", record debt load off the front of everyone's mind as they look at this market and put doubt (of market to go lower), disbelief (of the intensity of the counter trend rally) and FOMO (did you miss the bottom and are on the sidelines?) to the front of their minds.
Now, the technicals and the order flow...
While I noticed the 400C, 405C, and 410C flow for 2/10 (we all did in 🏆│golden-sweeps from discord also), we also can see the relentless addition of puts on SPY and QQQ for every single month both ITM and far OTM. Orderflow is indicating that nothing has changed as far as the more medium term picture, despite this rally to 418.
Technically speaking, it is a bullish breakout from a falling wedge, which has reached it's measured move. It also broke out of a rising wedge to the upside, which is usually a bearish pattern. However, a "bull trap" requires bulls and bears alike to be convinced that the direction is up, usually manipulated by making a higher high vs the previous, for technical analysts to consider it a break of a downtrend. However, this very well can be a very vicious bull trap and turn around very quickly. Remember bears can undo an entire month of up for bulls in just a couple of sessions.
Levels to watch:
8ema @ 407.86 50 SMA @ 394.71 200SMA @ 394.01. Orderflow levels 400.67, 396.60, 387.66.
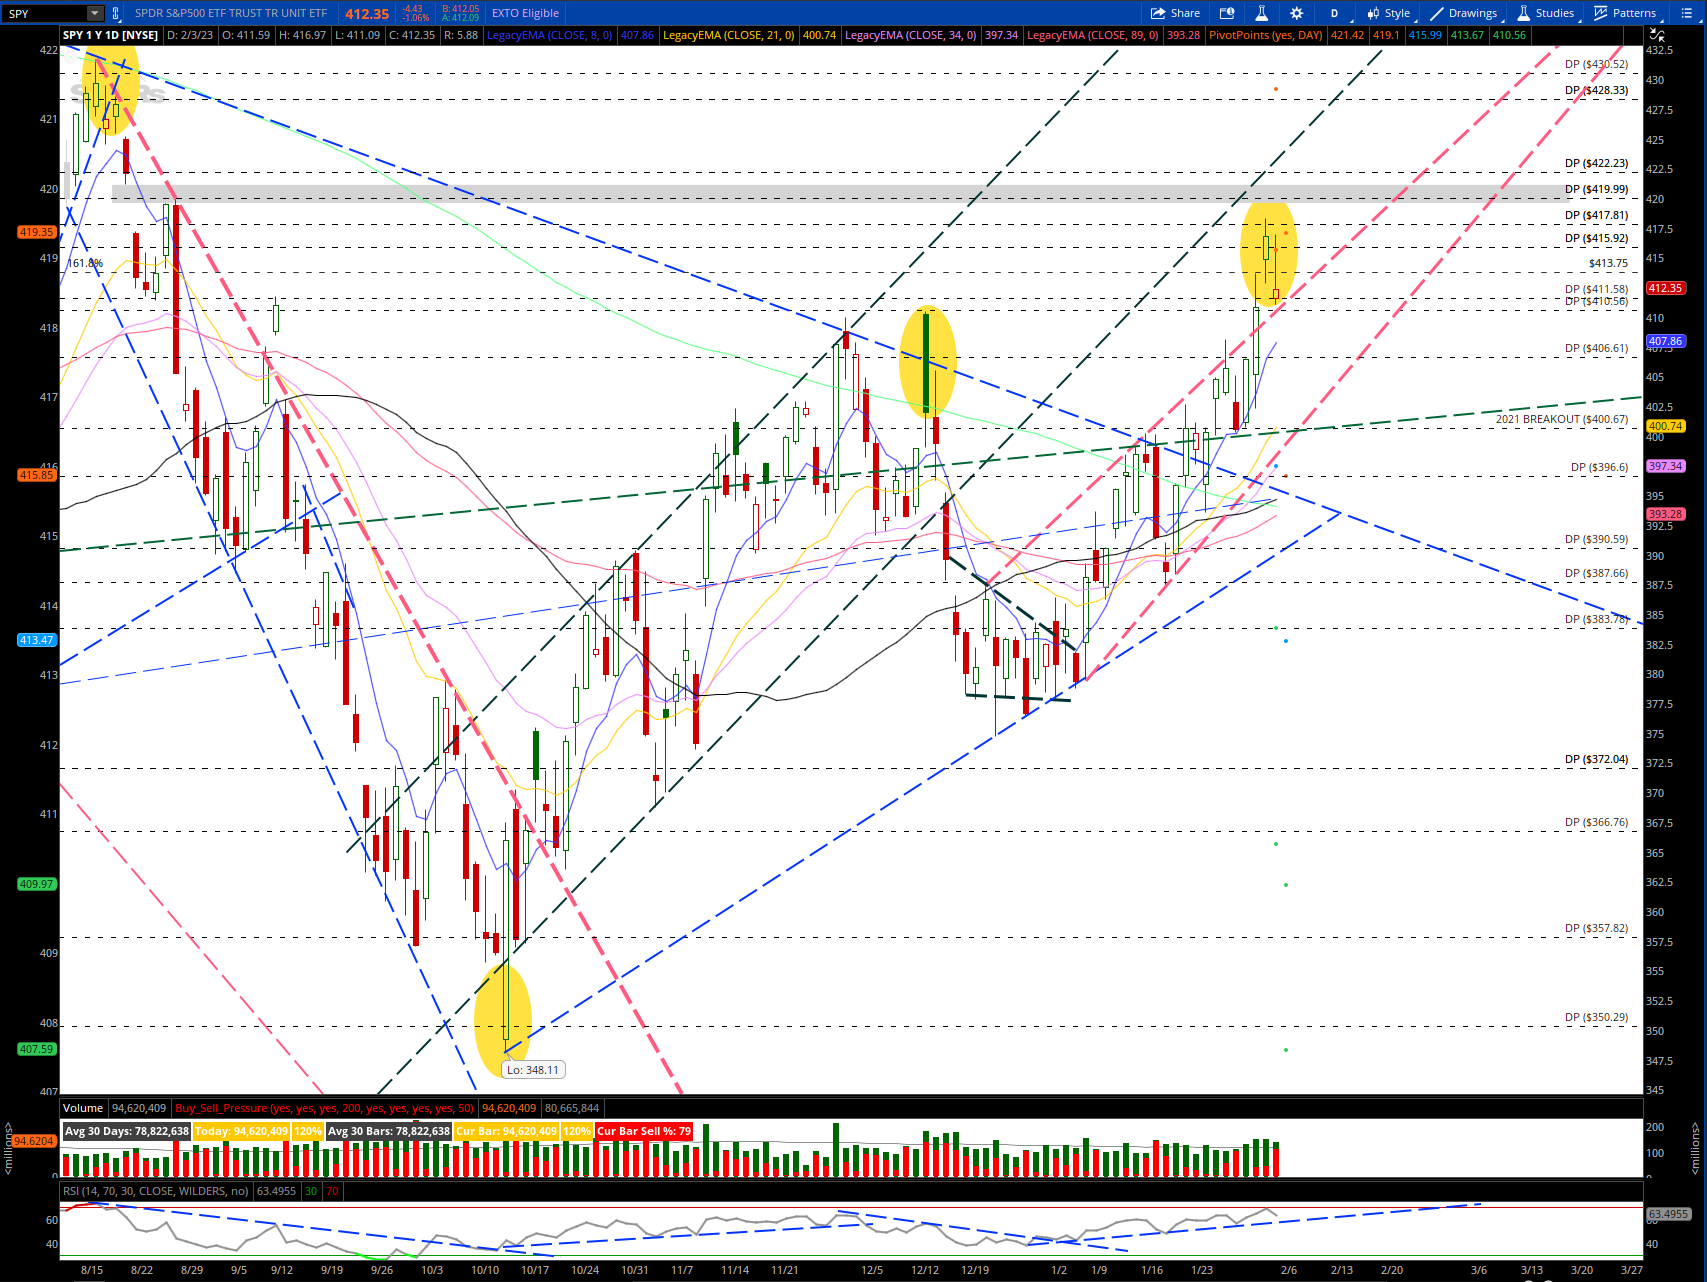
For the bulls, they want to see any visit to 406.61 hold as support and a bounce back to 420 for that gap fill (show in gray).
For the bears, they want to see a visit to 406.61 crack and move towards 396.60 to test the breakout and invalidate it.
I think, if bears can close under the 200sma this week, its a done deal and we will head to 383 in days.
TSLA 0.00%↑
In the immediate short term TSLA has formed a parabolic step curve pattern from 101 to 199 where it sold off about $10 the same day. There is flow in both directions, however, flow is mostly bullish suggesting a move to 235+. I think here, we need to be careful shorting this as the rest of the market may be an easier short/target.

A reminder of what a parabolic step curve looks like:

And here’s what TSLA’s daily chart looks like:
Immediate short term play:
Keep reading with a 7-day free trial
Subscribe to JR28 TRADING SUBSTACK to keep reading this post and get 7 days of free access to the full post archives.