


Week of January 1st, 2024
9 green weeks in a row for $SPX to close out 2023, what's next?

Hi everyone! HAPPY NEW YEAR!!
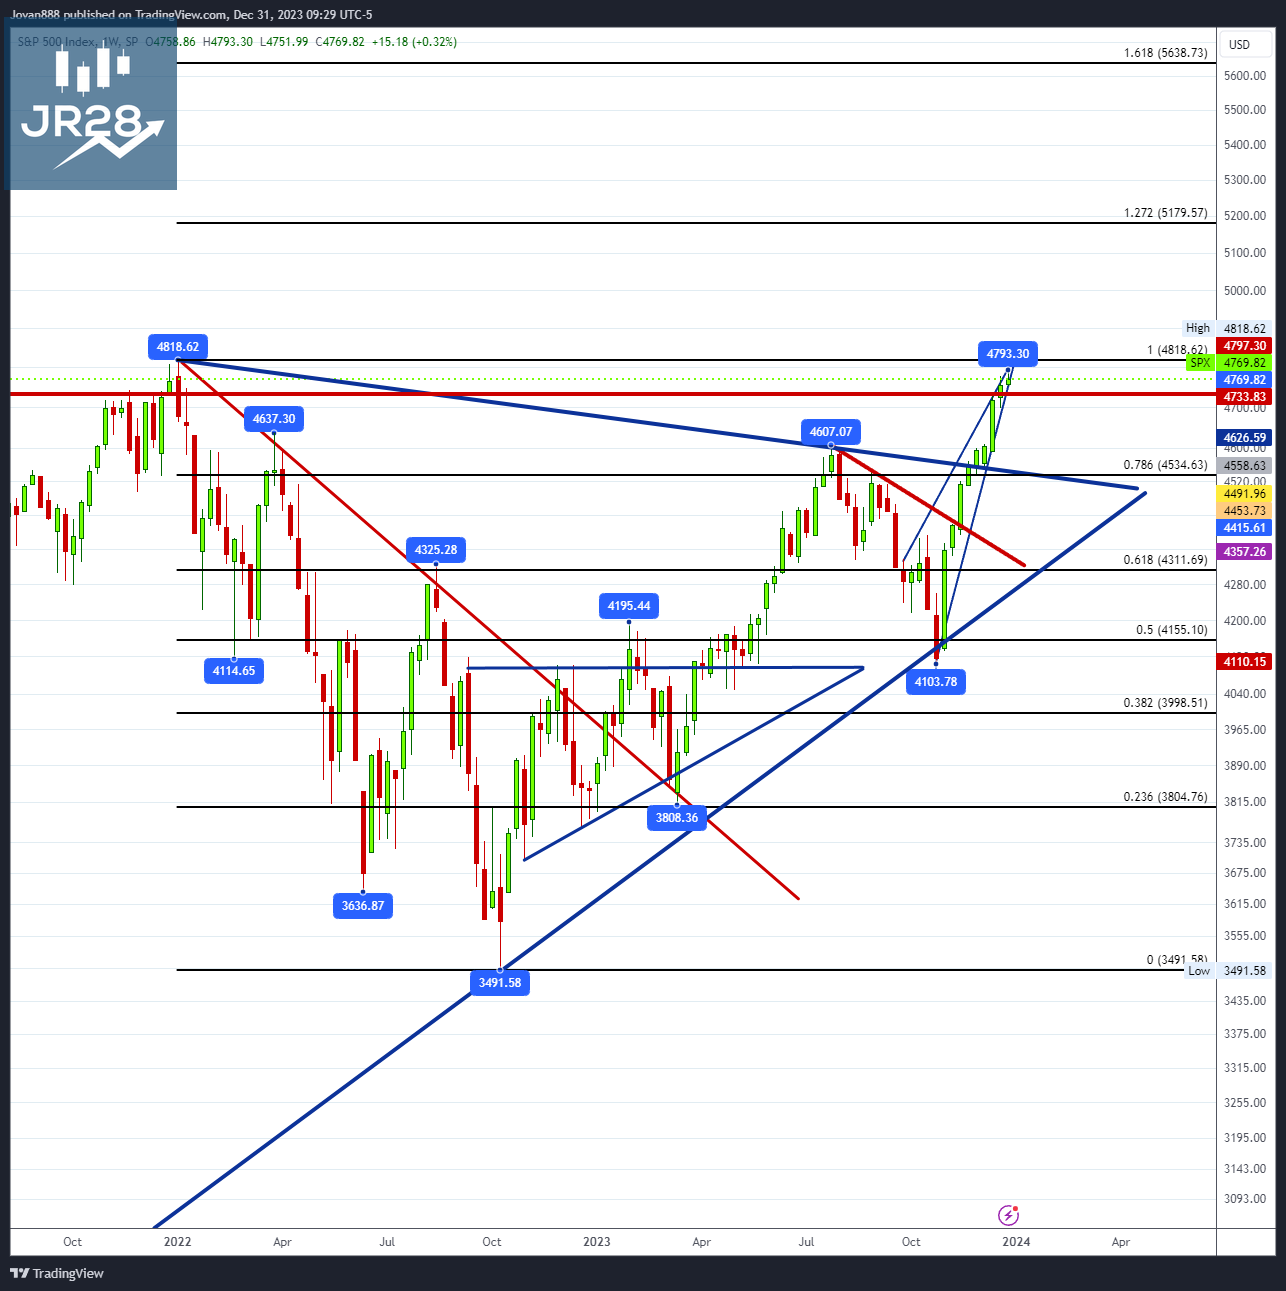
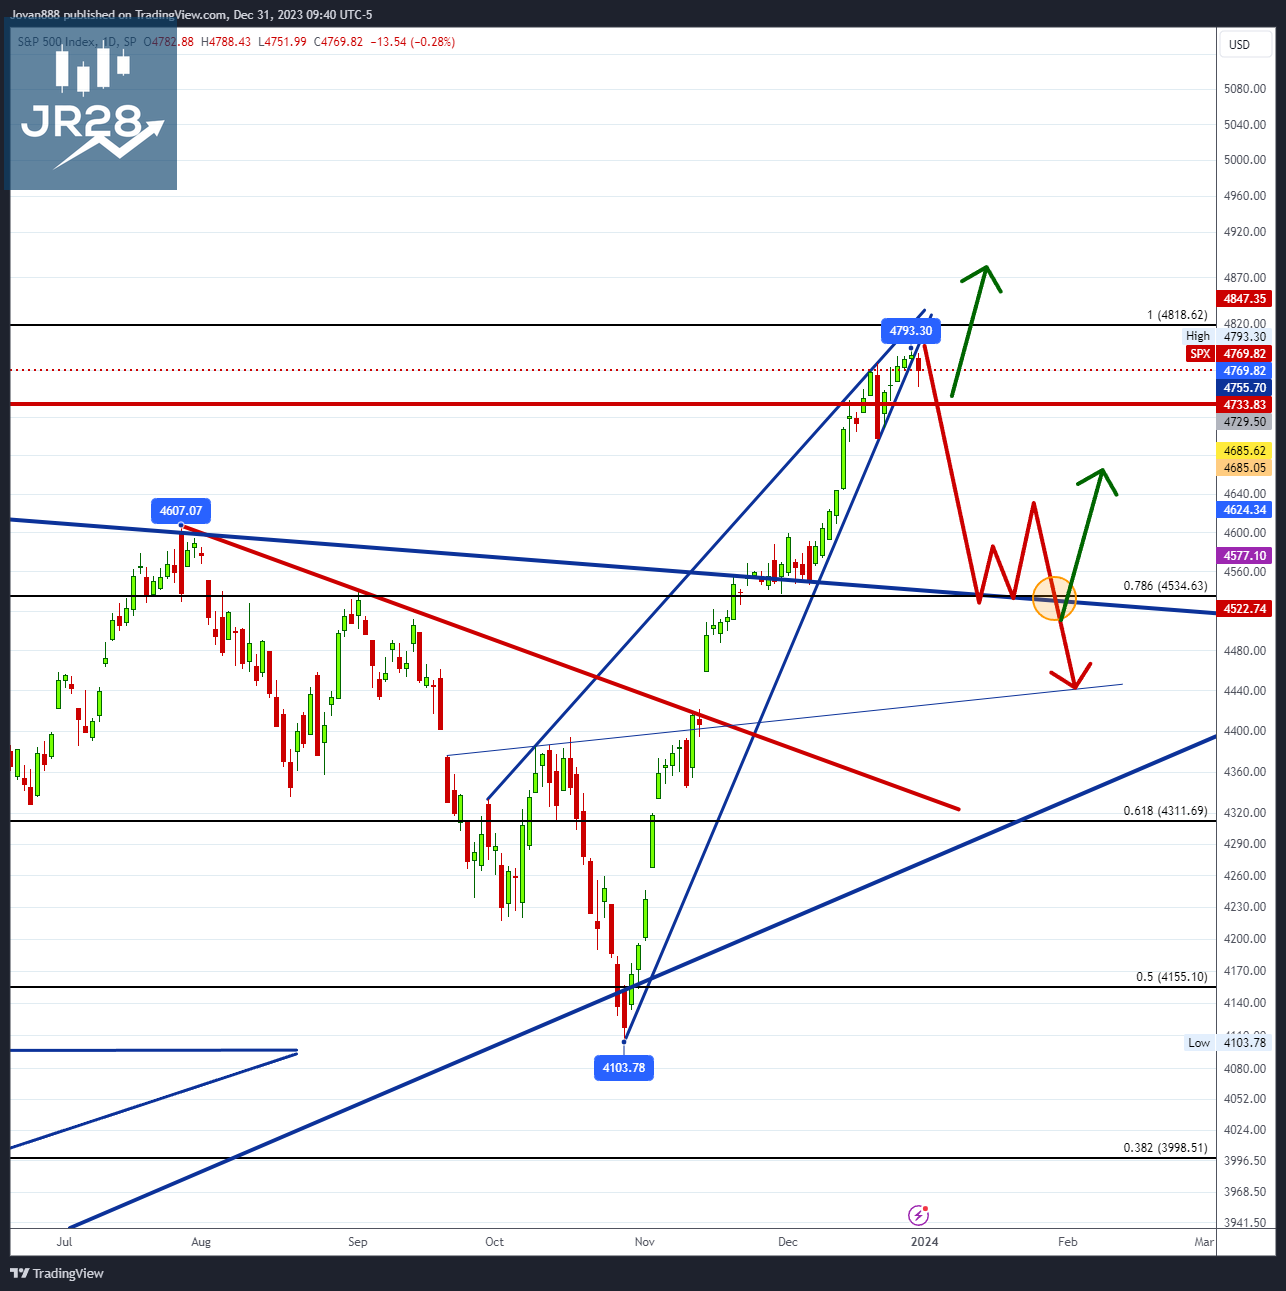
This past week we got our 9th consecutive green week in a row in what has clearly been a lockout rally and kept anyone waiting on a dip sidelined or forced to FOMO in at the highs. This is a green streak that has not been seen since 2003. It should be noted however that the bullish side is a bit overcrowded and chasing here is very risky. If long since earlier in the month, it’s just a matter of raising stops until a support fails. But if you are initiating a long position, this isn’t the place to do it. Even Tom Lee is calling for a pullback to 4400-4500 area and you can see on the chart above the significance of that area (breakout retest).
Key for the next few weeks: BTD as long as supports hold, if support falls a short trade begins and the short trade does not end until a resistance is reclaimed. This means if you have been programmed to buy every single dip, and supports begin to fall, you need to pivot quickly or you will give back all your gains trying to buy every dip in the middle of a multi-day multi-support flush.
Last week I mentioned “Can try chase longs over 4756 to target 4769 and then 4794 and an attempt at the ATH at 4818. Be very tight with the stops and be prepared for fails.” We hit exactly 4794 before pulling back to close the week at 4769.

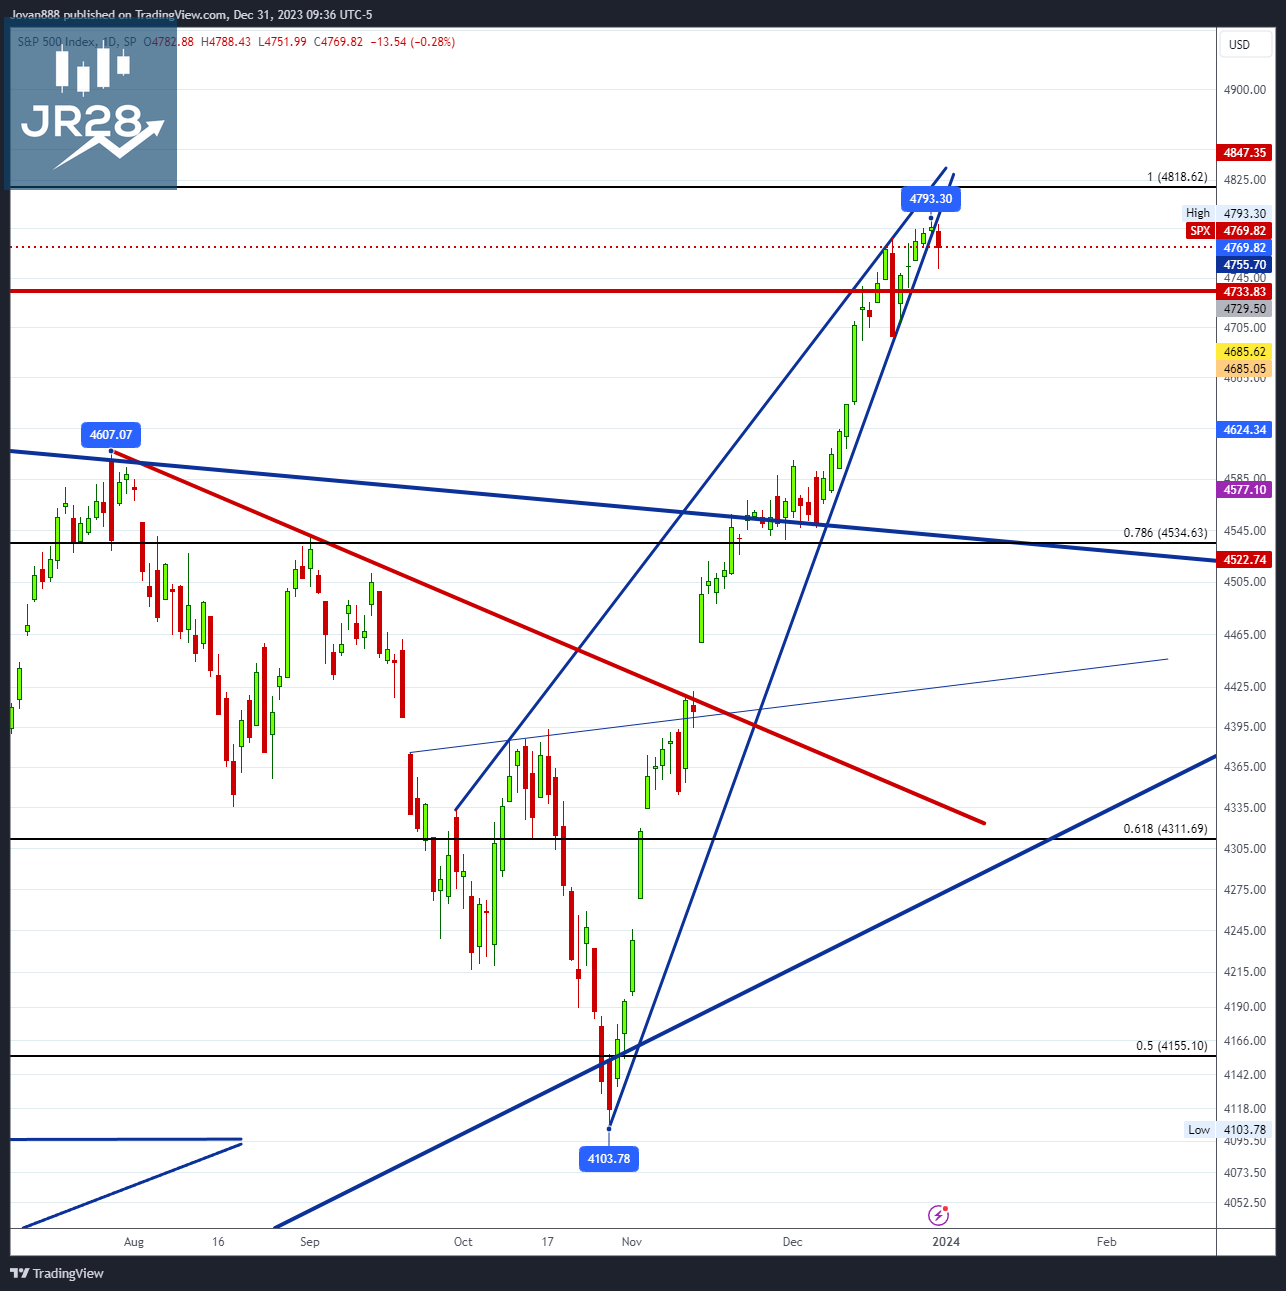
Something I have mentioned time and time again is that in bullish trends bearish patterns tend to fail and in bearish trends bullish patterns tend to fail. This is why we have continued to see bears get roasted despite every bearish setup along the way. However this has it’s limits and bears are thrown a bone every once in a while. Here we can see a rising wedge (bearish pattern) into prior ATH territory. I’ve marked a red line to signal a pivot/turning point next week. If we start to close below that red line, we may see the start of a larger 200pt sell.
SPX Analysis:
Key Levels: 4734 & 4794
Extreme risk at current levels for new longs. Very high risk of sudden rug pull of multiple support levels (200pts+)
Bullish Trajectory: High risk for new longs as this breakout reaches its mature stages. If taking longs be prepared for a multi-day sell to come at some point suddenly and don’t get stuck buying every dip. Can try chase longs over 4733 to target 4769 and then 4794 and an attempt at the ATH at 4818. Be very tight with the stops and be prepared for fails.
Bear Trajectory: A break of 4733 likely leads to a retest of the FOMC breakout at 4655. If 4655 falls then this turns into a failed breakout and can continue down to 4607 and 4575. There is support here that was not there in the July breakout, however if this falls we can see retest of 4534 where I would expect some meaningful bounce to occur.
Summary:
Watch this red line as your pivot/turning point and be careful being long if below it. Personally, the red path has a bit more weight since we broke down out of the rising wedge, however due to the resilience of this rally we can’t ignore the possibility of another failed breakdown which is why the red line will be our guide.
IWM 0.00%↑
Hard Rejection and possible warning of pullback, but that is to be expected after this green streak. Watching this 190-193 zone if it holds on dips for a push into 203 and 212. Must see an S/R flip at 203.07 for the move to 212.83 and 216.83.

QQQ 0.00%↑
Fresh all-time highs on QQQ. Same situation here as SPY with this rising wedge, this 408 level will be key, if it holds then we might have a failed breakdown and continue up higher. But if 408 falls we can start a pullback to 398 and 394.

TLT 0.00%↑
Trapped under $100 level, might see some sort of flagging or pennant consolidation here before it attempts the run to 105

TRADE ALERTS:
For those of you not in the Discord (www.jr28trading.com) I highly encourage it as we cover a lot of the setups given here but we also alert LIVE trade ENTRIES and EXITS.
There is currently an end of the year sale if you use the promo code “2024".”
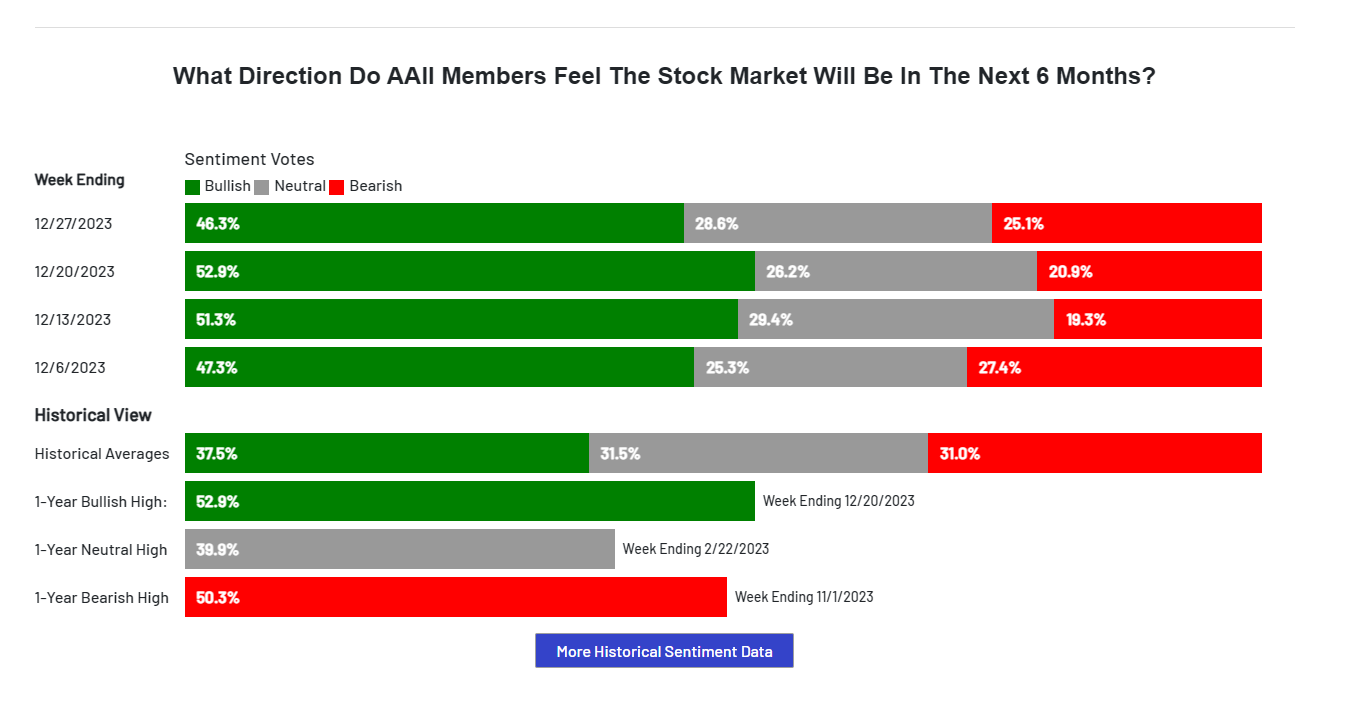
Sentiment Check:

Comments:
We are now in extreme bullishness levels, so a big red flag for anyone new to the long side. I’ve noticed over time that the fear & greed indicator works when we visit an extreme and then leave it, that marks the turning point, however we can remain in “extreme” for some time before that happens.
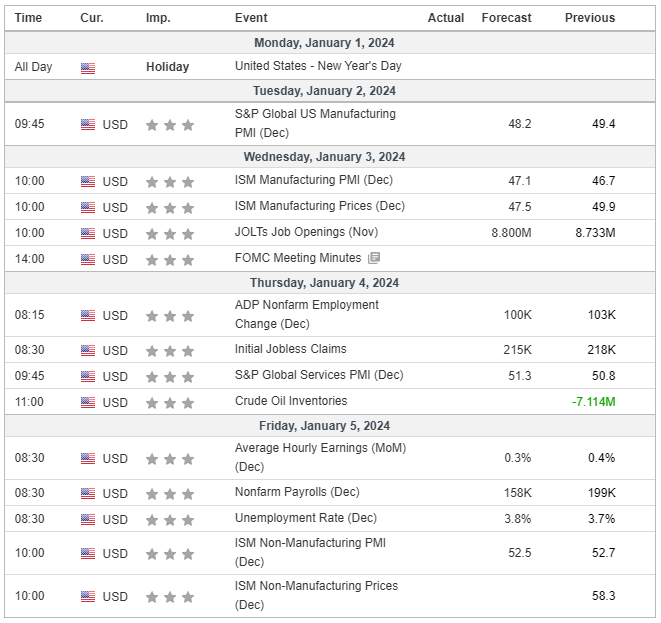
Here is the economic calendar for next week:
A separate newsletter will be sent tomorrow with the setups I am watching for next week to paid subscribers.
Have a wonderful weekend!
Wishing you a successful and profitable trading week ahead!
Best regards,
Jovan