


Week of May 29nd, 2023
Further consolidation within the megaphone for $SPY, $QQQ attempts breakout
Last weekend I put out this setup on $ES_F with a 4155 pivot and I specifically stated that any sells down into that 4156 area would likely produce a bounce to retest 4230. We did exactly that, with an initial sell and then a BTD back up to exactly 4230. See below:
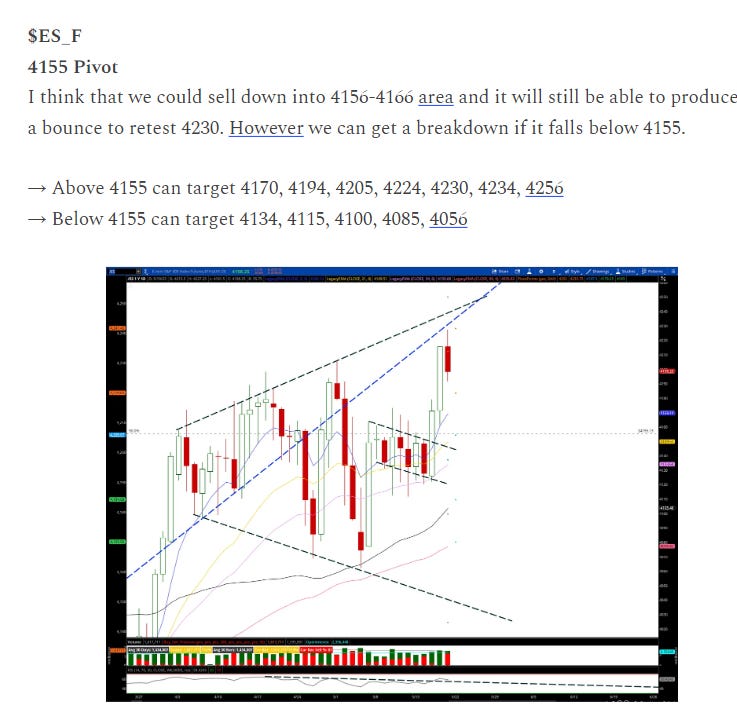
Now that we retraced the breakout and held 4155. we still have some room ahead next towards my 4234-4256-66 targets. However, it’s important to note we did already hit 4243 in AH at time of this post. We are approaching major resistance and we likely experience a sharp pullback soon.
It’s important in times like these to keep focused on the broader perspective. While it may seem “bullish” you need to keep in mind that we are just a typical downtrend, lower highs and lower lows. And, while we did put in a higher low technically, we have not yet put in a higher high in the bigger picture. See below the SPY 0.00%↑ weekly chart:
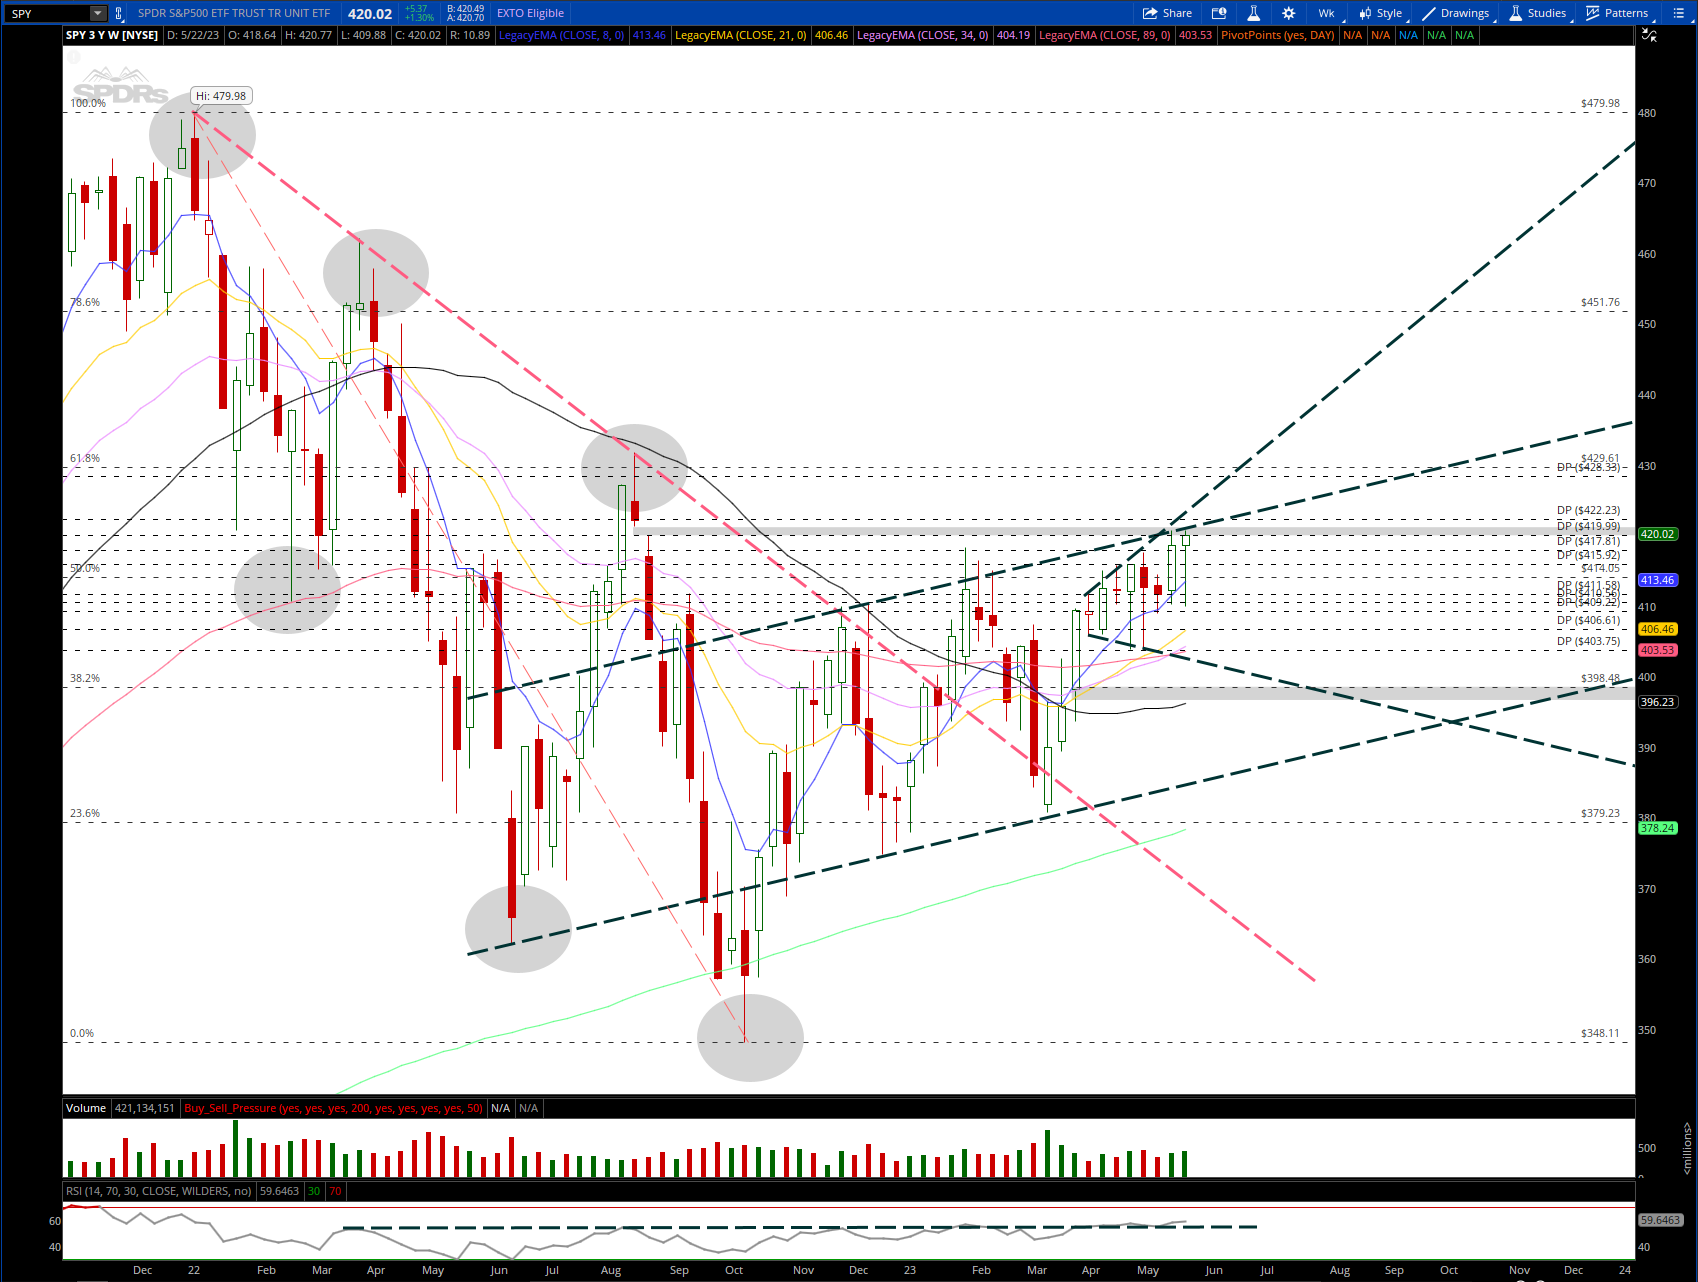
The past 12 months show a trading range between 360-430 and it is very premature to be calling this a new bull market. Although I’m hesitant to call this rangebound trading a “rally” this move has largely been caused by a “flight to safety” influx of funds into big tech. While some like $AAPL, $MSFT, $GOOGL, $NVDA, and others have had large rallies, the broader part of the indexes have not.
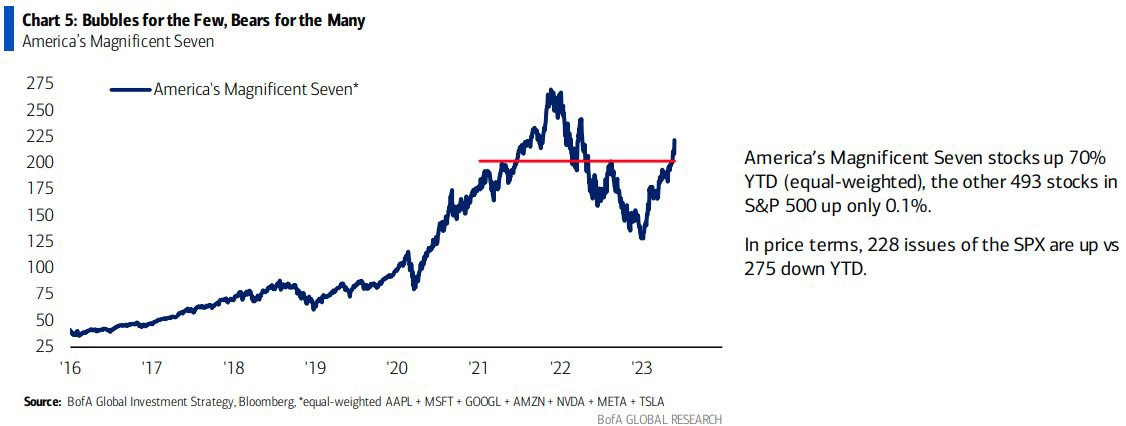
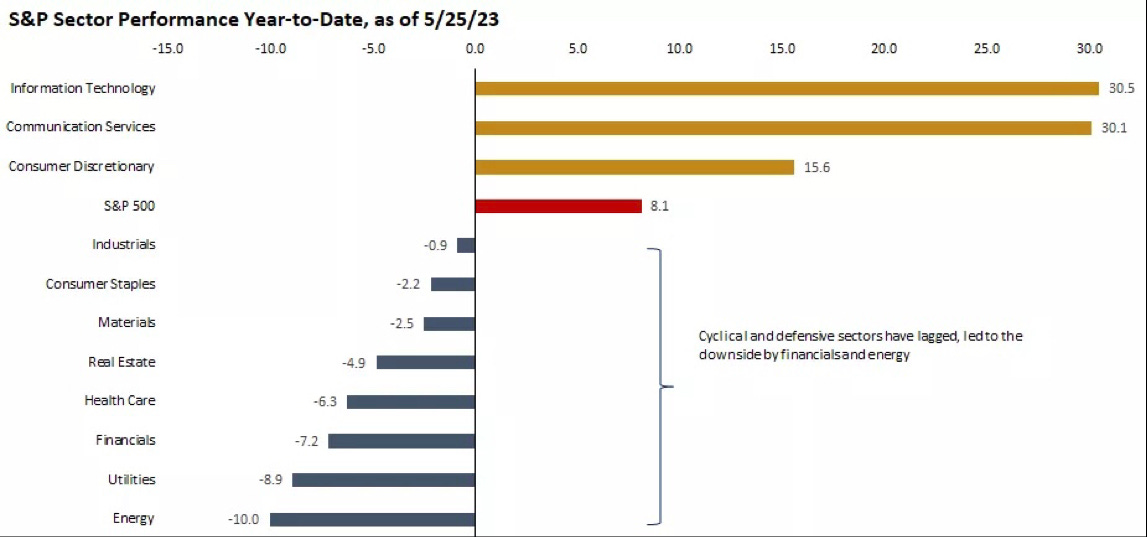
It’s also very obvious if you look at the other indexes and ignore Tech.
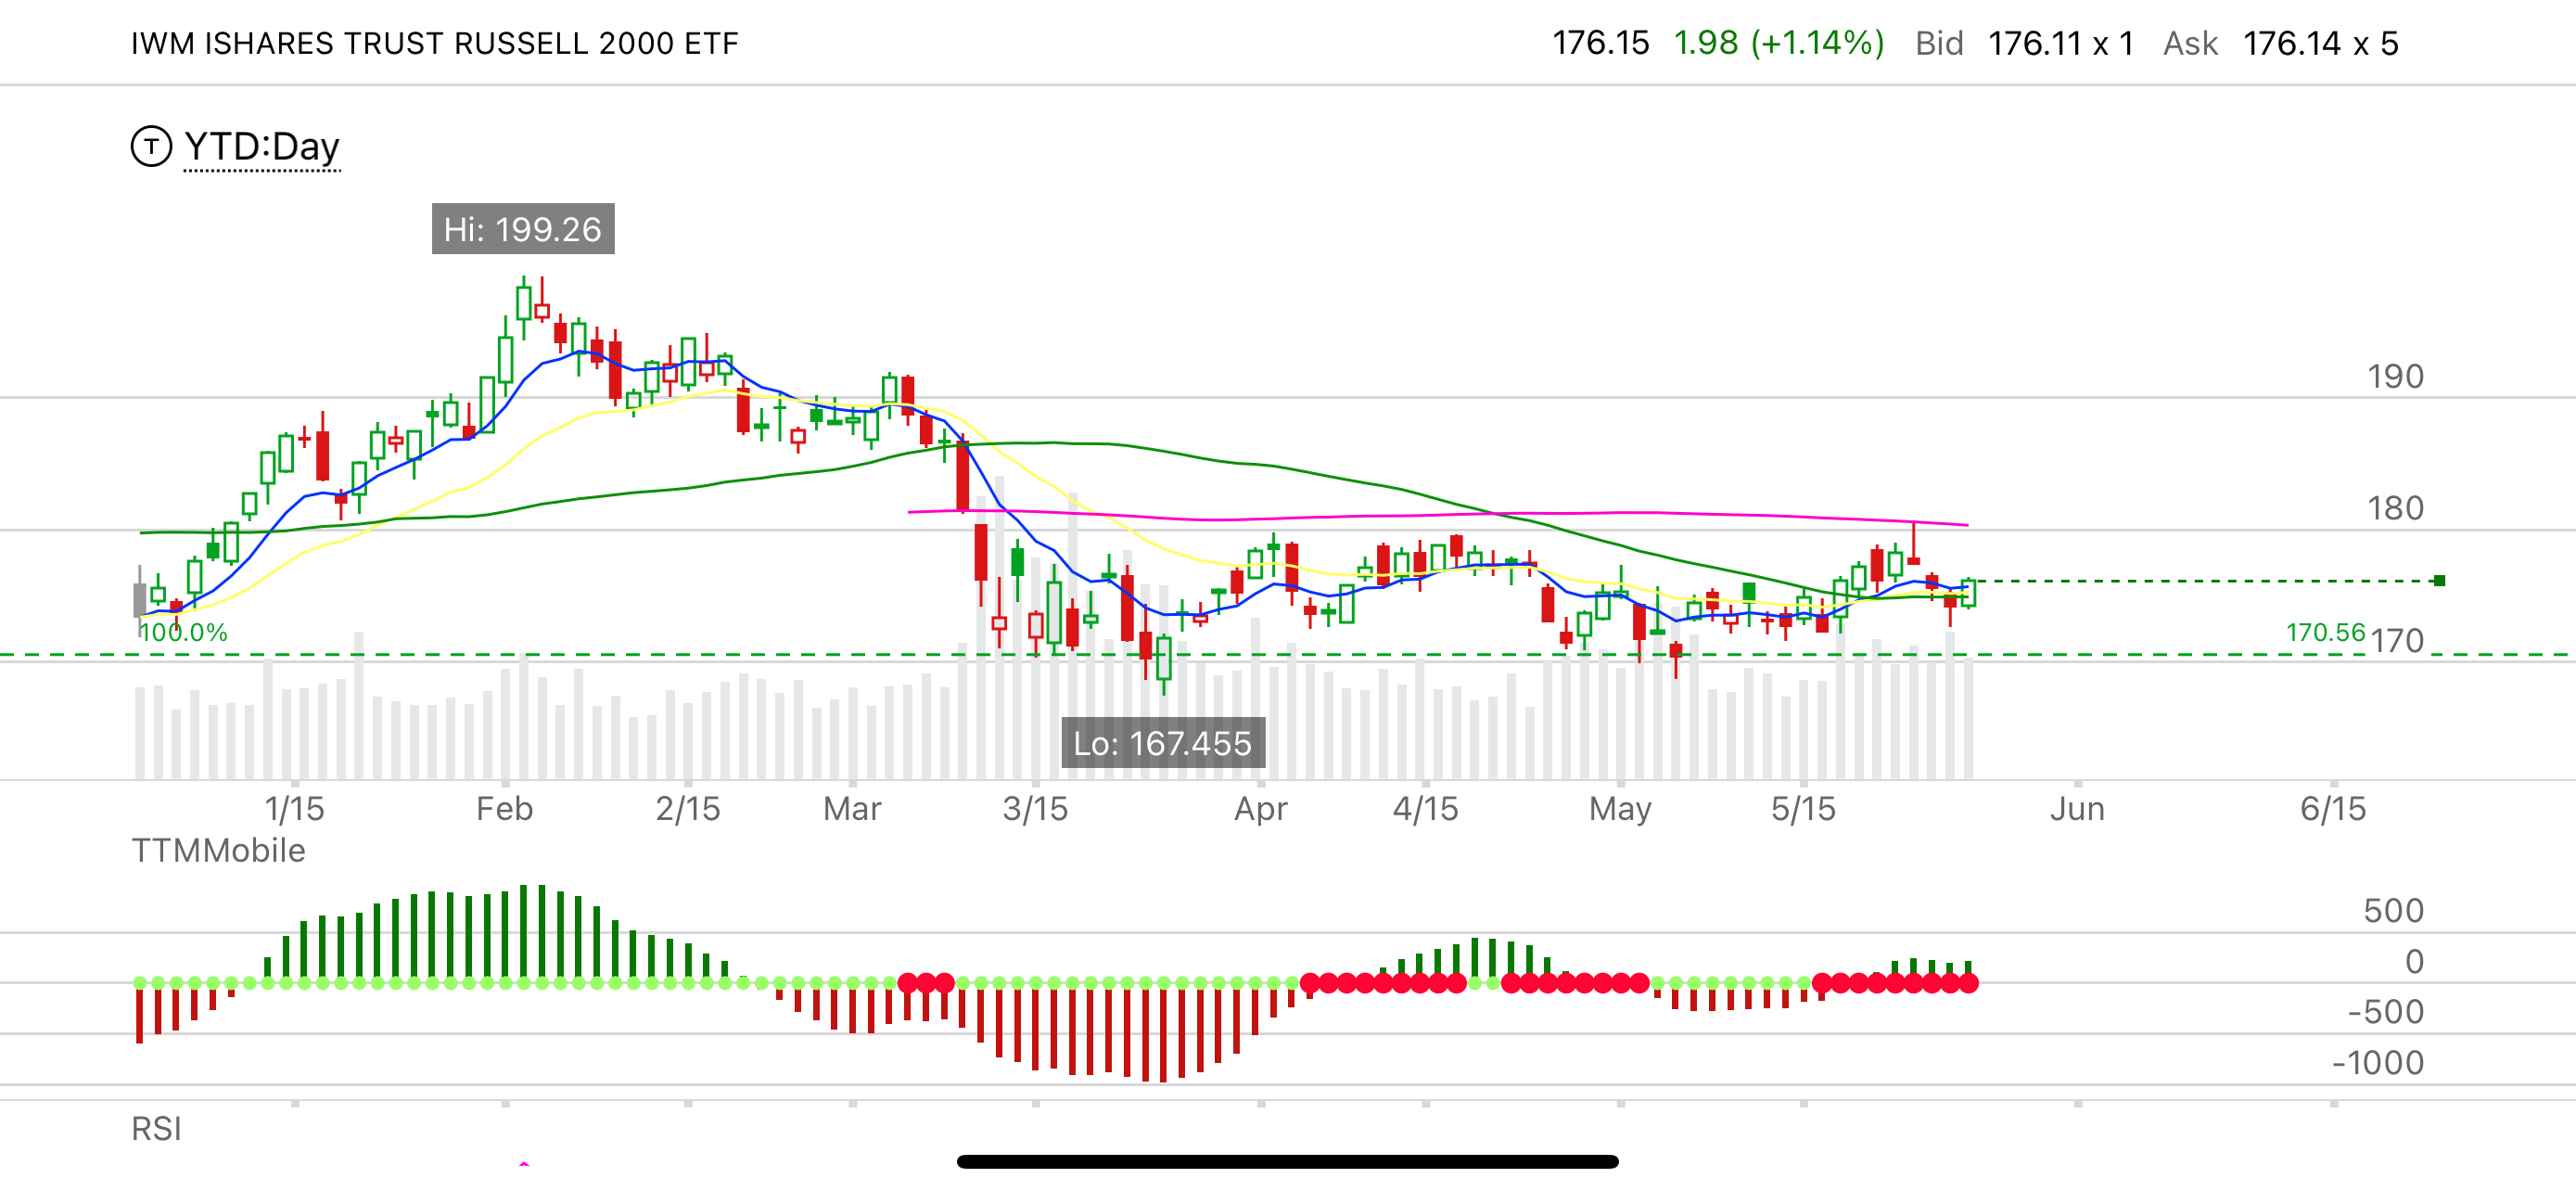
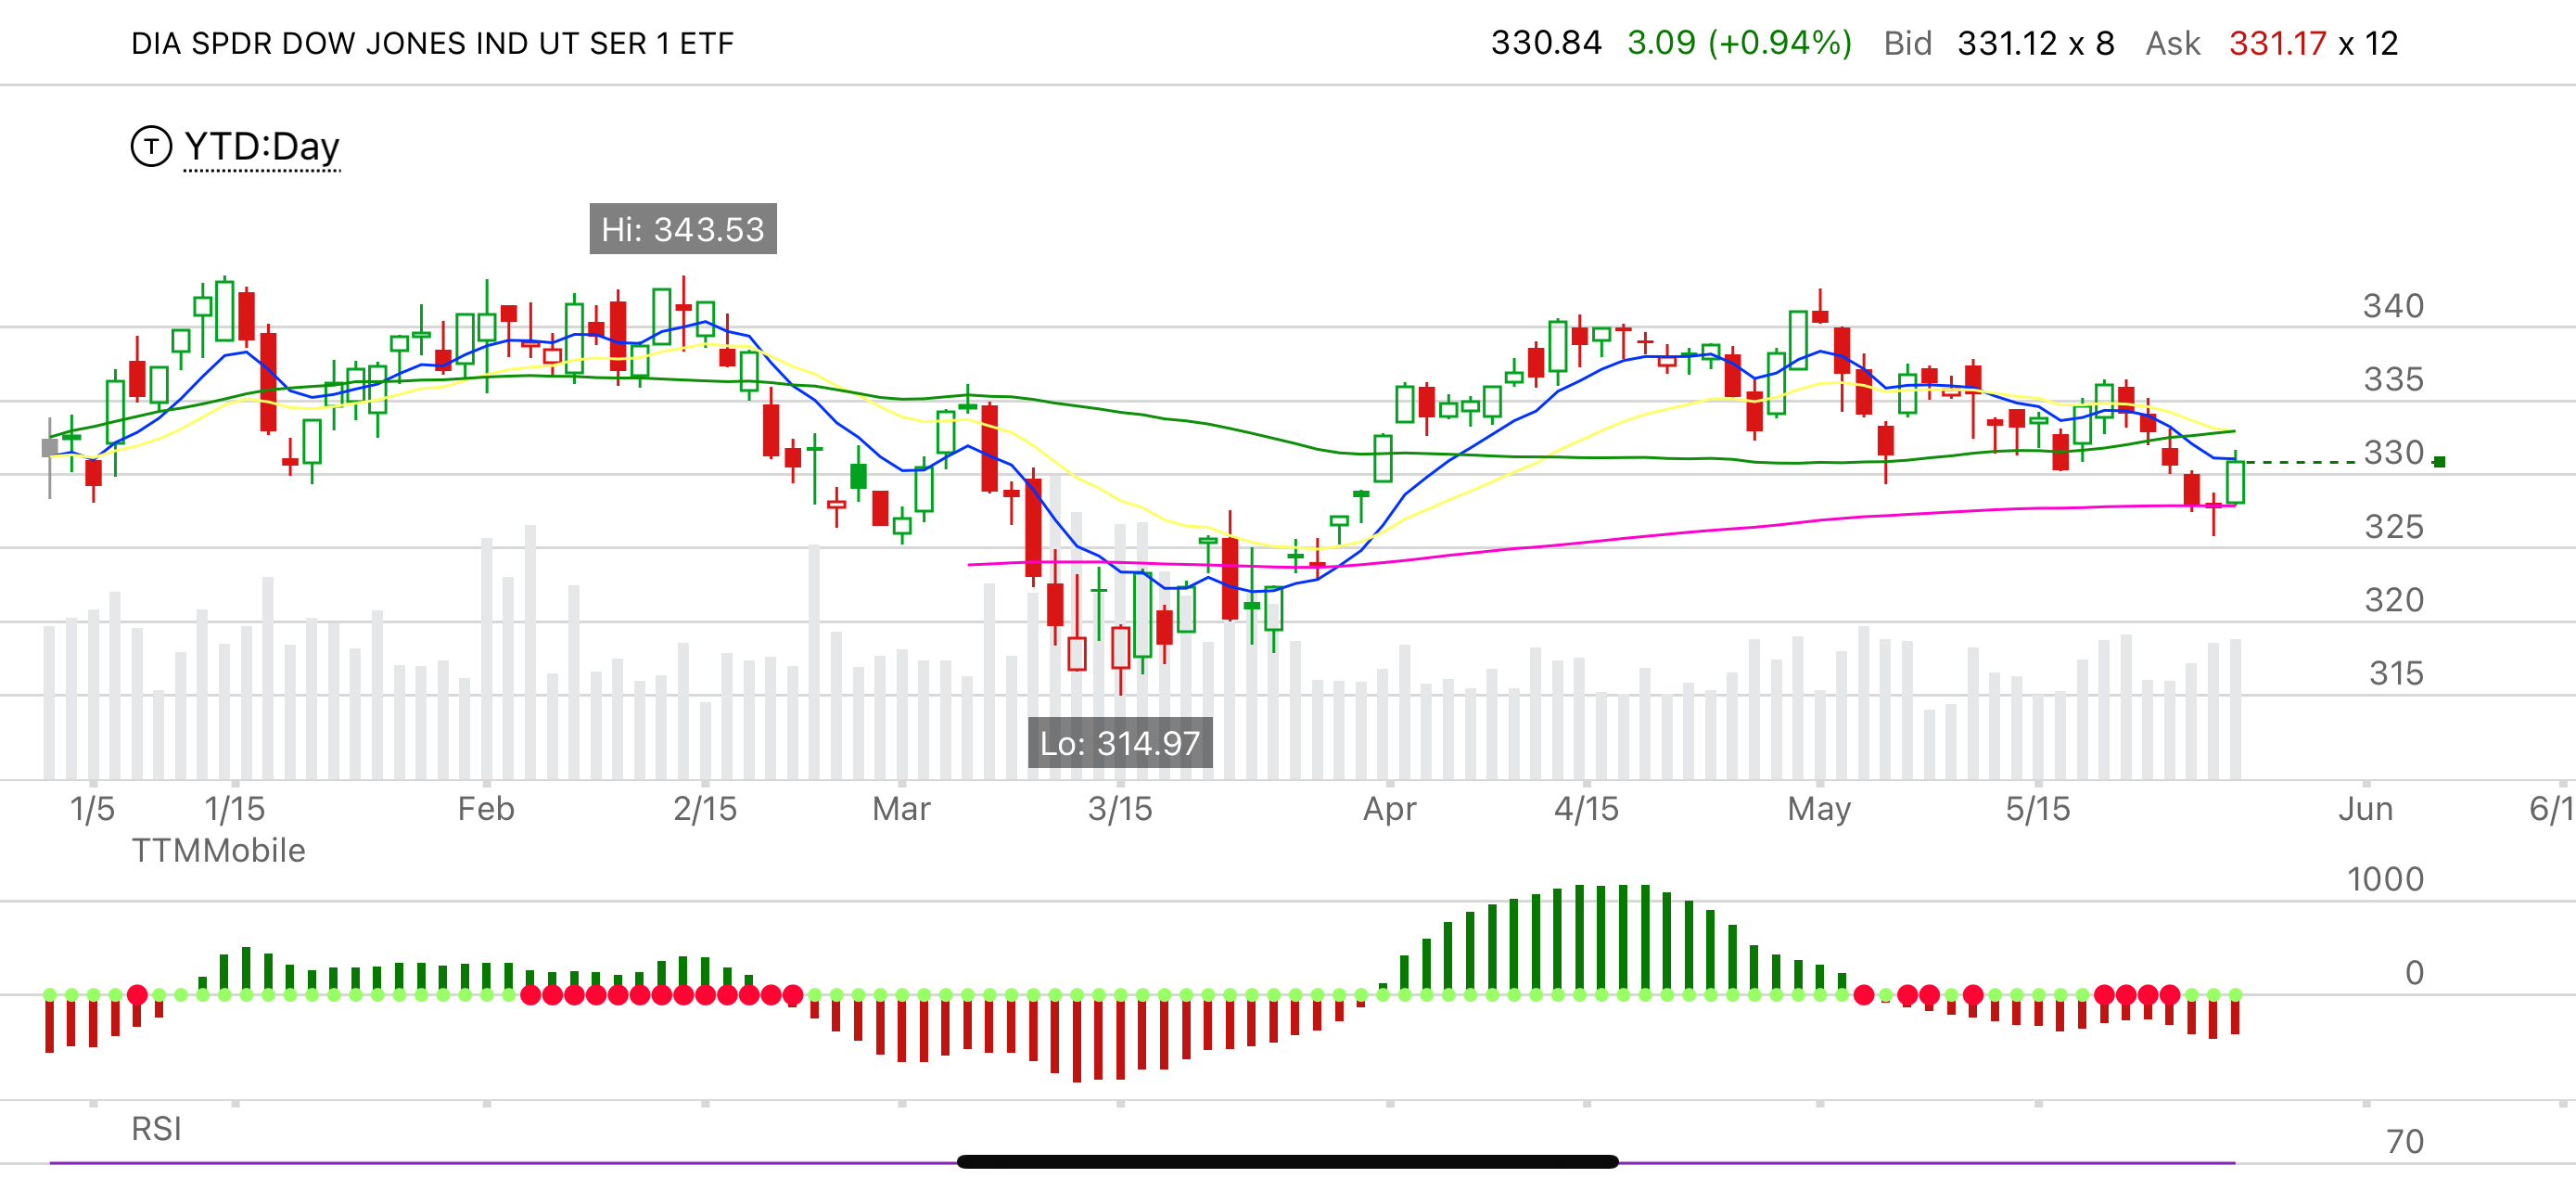
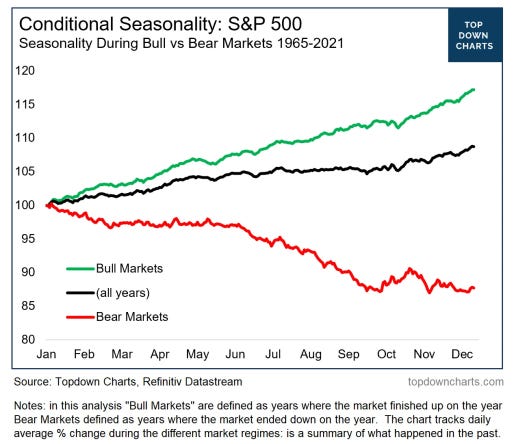
Here is the conditional seasonality for the S&P 500, however keep in mind the charts above YTD of the IWM and DOW. If this were truly a bull market, and the bear market had ended, the small caps would not be where they are (in my opinion)
SPY 0.00%↑ has now entered the gap fill area from the August selloff however it has left an unfilled gap below at 396.49 which will eventually be filled. We also have had many many large dark pool transactions near 416-420 area.
We continue to see some quality setups for the weeks and months to come which are shared with paid subscribers and in the discord. You can join the discord at (jmoptiontrading.com)
Something to keep in mind is that I prefer to make fewer larger higher RR trades throughout the year vs more frequent higher risk trades. This means I may personally pass on daytrading/swing trading something like SPY from 415 to 430 but go heavier on something like SPY 415 to 340. I like big range moves, and I’m willing to be patient on them for a potential high reward trade.
For this upcoming short week I will be watching the following setups and levels:
SPY 0.00%↑
Continue to observe this large megaphone (daily) and bull channel (weekly) as it approaches major resistance at 421.11-422.23. This area should serve as a stop or halt for this rally if we close the next week below it. We can then start to explore the lower end of the megaphone around $400 if we manage a break below $414.05. This will be our pivot for the week.
422.23 Pivot
→ Below this we can start a pullback back to 419.99, 417.81, 415.92, 414.05, 413.75
→ Above this bulls can continue towards 428.33 but IMO we are very extended and we need a pullback otherwise there is very high risk of rug pull.
$ES_F
4234 Pivot
I think that we can pullback towards 4187-4194 area which may be supported for continuation as long as there is no negative news regarding default.
→ Above 4234 can target 4256-4266, 4275
→ Below 4234 can target 4224, 4211, 4204, 4194, 4187.
→ Bigger pullback occurs if 4187 fails, to likely retest 4115.
QQQ 0.00%↑
RSI is overheated on all timeframes. Due for pullback. Heavy resistance in a fib cluster at 349.71-354.84. I cannot consider the long side here without a sharp pullback.
→ using 354.84 as a LIS, consider pullback to 343 to retest breakout. Below 343 can target 8ema at 337. Reminder there is a gap below left at 332.91
TSLA 0.00%↑
198.02 Pivot
→ Above pivot R levels are 200.22 (200sma), 204, 210
→ Below pivot can target 194, 190. If 190 falls then target 183.
AAPL 0.00%↑
Important to look at bigger picture which is that it is technically in a weekly upside breakout. My opinion though is that this is a relatively low risk short (not 0dte) due to the valuation, overheated rsi, supporting orderflow and the fact that this upside breakout is on declining volume and low volume.
175 Pivot
→ Above this can target 180-182.94
→ Below this can retest wedge bottom at 168. Below this is a breakdown to 50sma 162.36
NVDA 0.00%↑
NVDA is stretched on all timeframes. It appears market wants it to hit the 1T valuation which is at 404. It is at very high risk of a significant pullback to 346. I cannot chase long here, however i will consider shorts on a touch of 404, or on a break below 375 to target 346.67 / 336.01.
GOOGL 0.00%↑
125.49 pivot
→ Below this RSI reset target 117.45-118.77. Below that target 113
→ Above this is a parabolic run to 136.95 which is a very risky chase.
That’s all for now, stay tuned to the discord for real-time updates.
Have a wonderful rest of your weekend!
-Jovan