


Week of October 9th, 2023
First week of October breaks red streak, CPI ahead.

Hi everyone!
In the prior newsletter I mentioned that SPX put in 4 consecutive red weeks, something it had not done before in 2023. Last week we got our first green week since August and finally broke that red streak closing the week at 4308. I gave the 4240 and 4335 levels as the range cap and while we did briefly go below 4240, we put in a failed breakdown and rallied hard after making a lower low at 4216 on Tuesday when we got close to the 200sma. It’s important to note however that while we got close to the 200sma, we did not actually tap it which leads me to think we may not have seen the lows yet.

Here’s the price action for last week:
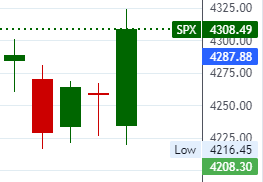
This is a clear DOWNTREND with lower highs and lower lows.
Remember to follow me on Twitter @jovanroche or join our discord JR88 DISCORD for live updates. We jumped in calls near the lows and we sold those on Friday before the close.
SPX Analysis:
Key Levels: 4240 & 4335
Bears are fully in control below 4393. Bulls need to take out 4335 for a short squeeze back to 4395. Because of the importance of this level, 4335 may be difficult to overcome and require several tries. Eyes on the open gap at 4401 as if we approach and fail to fill the gap it can lead to a rug pull of multiple support breaks and deeper lows like it did back on September 1st. For the bull a small dip into 4267 or so is ok, however bull does not want to lose that or else this was a bull trap.
Bullish Trajectory: Bulls need to overcome resistance at 4335 to squeeze towards 4351, 4379 and 4395. High risk of rug pull for bull below 4395 as trend can continue to be short the rips while below it. There is an open gap at 4401 which will act as major resistance until it has been filled. 4395 is a fib level but also the 100dsma is right there as well. Above that is 4413-24 which is the 50sma.
Bear Trajectory: Bears hate this 4240 level as they have had so many shots to take it out but could not. They got close to the 200sma but could not manage a proper test of it implying that bears were weak. Bear will need to manage a close below 4240 (something it only did on 10/3 before recovering the next day. If bear can close below 4240 then we can tap the 200sma properly at 4208 and likely we would break through it since we did basing above it (trap) which would target 4180 at a minimum and 4156-4167 next after that.
Note: While Friday’s candle appears very bullish, the volume was not impressive especially if looking at the megacaps like AAPL, TSLA etc. I suspect there was some short covering at play and a bull trap being put in. Bears need to take out 4240 level for a deeper sell and bulls need to overcome 4335 for upside continuation

Quick review of the indices…
SPY 0.00%↑ daily chart shows the downtrending channel action - with an effective RSI reset and the basing above the 200sma but failure to tap it and reclaim first.

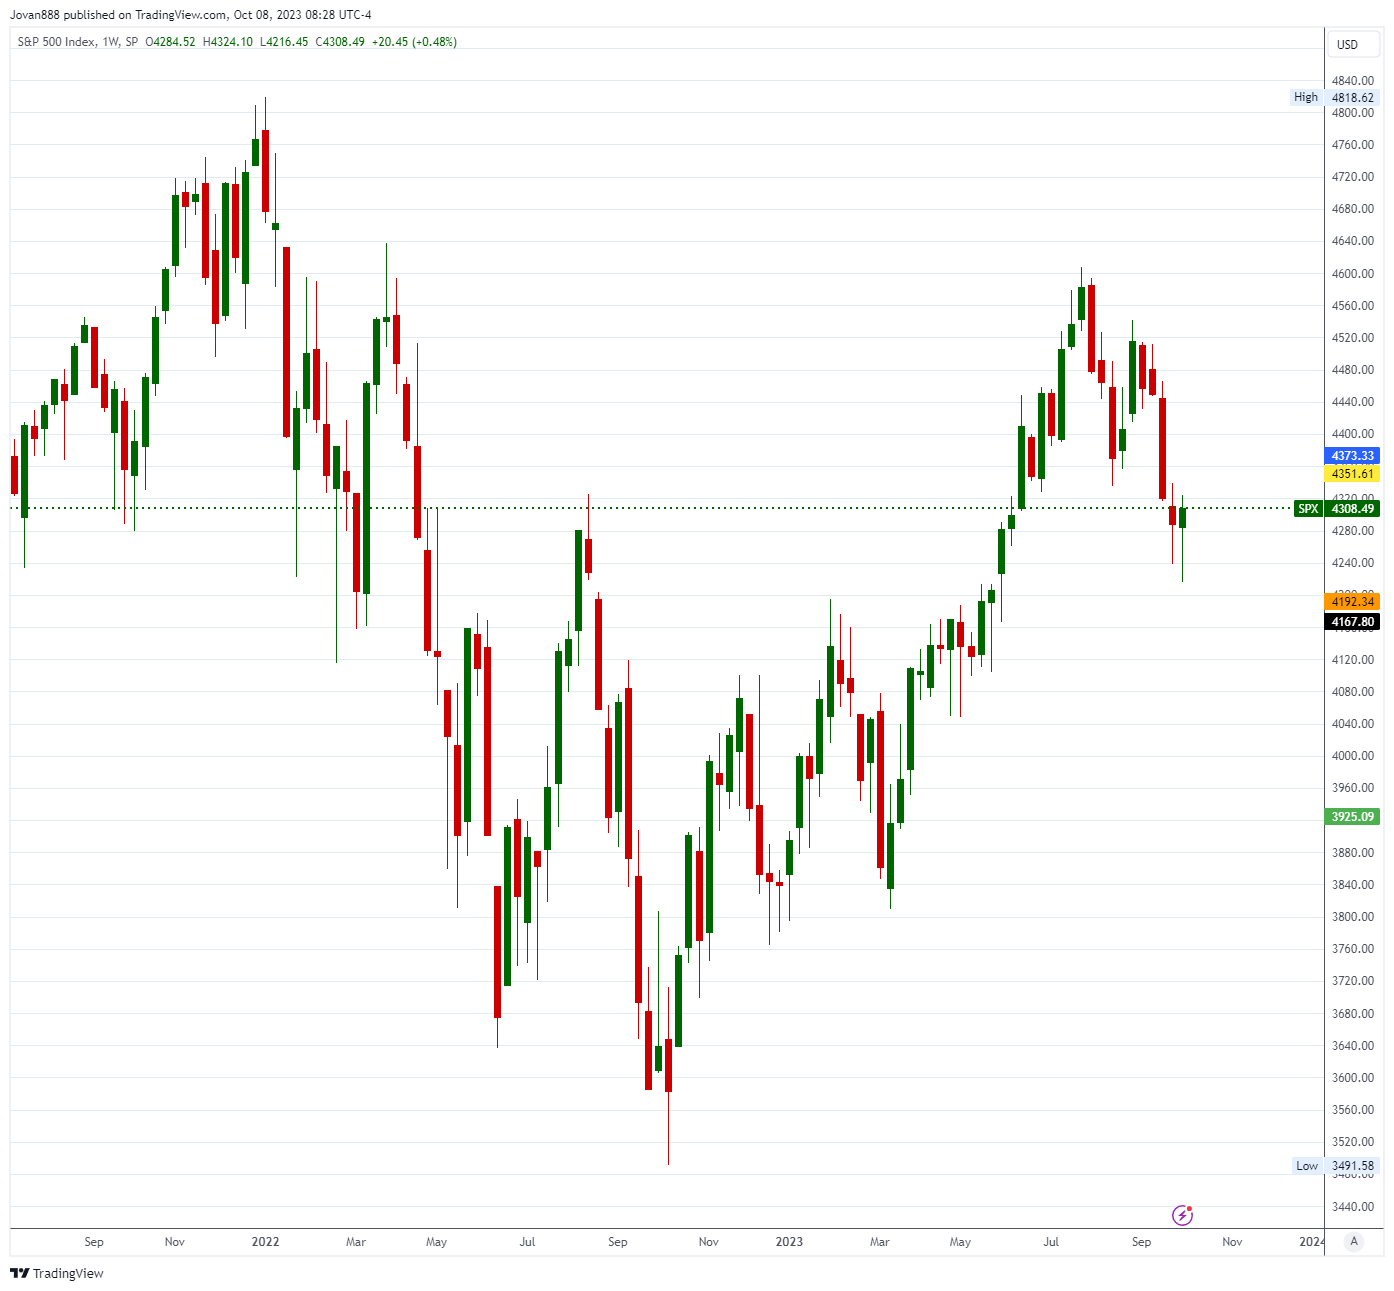
The weekly chart for SPY 0.00%↑ shows the rising wedge breakdown
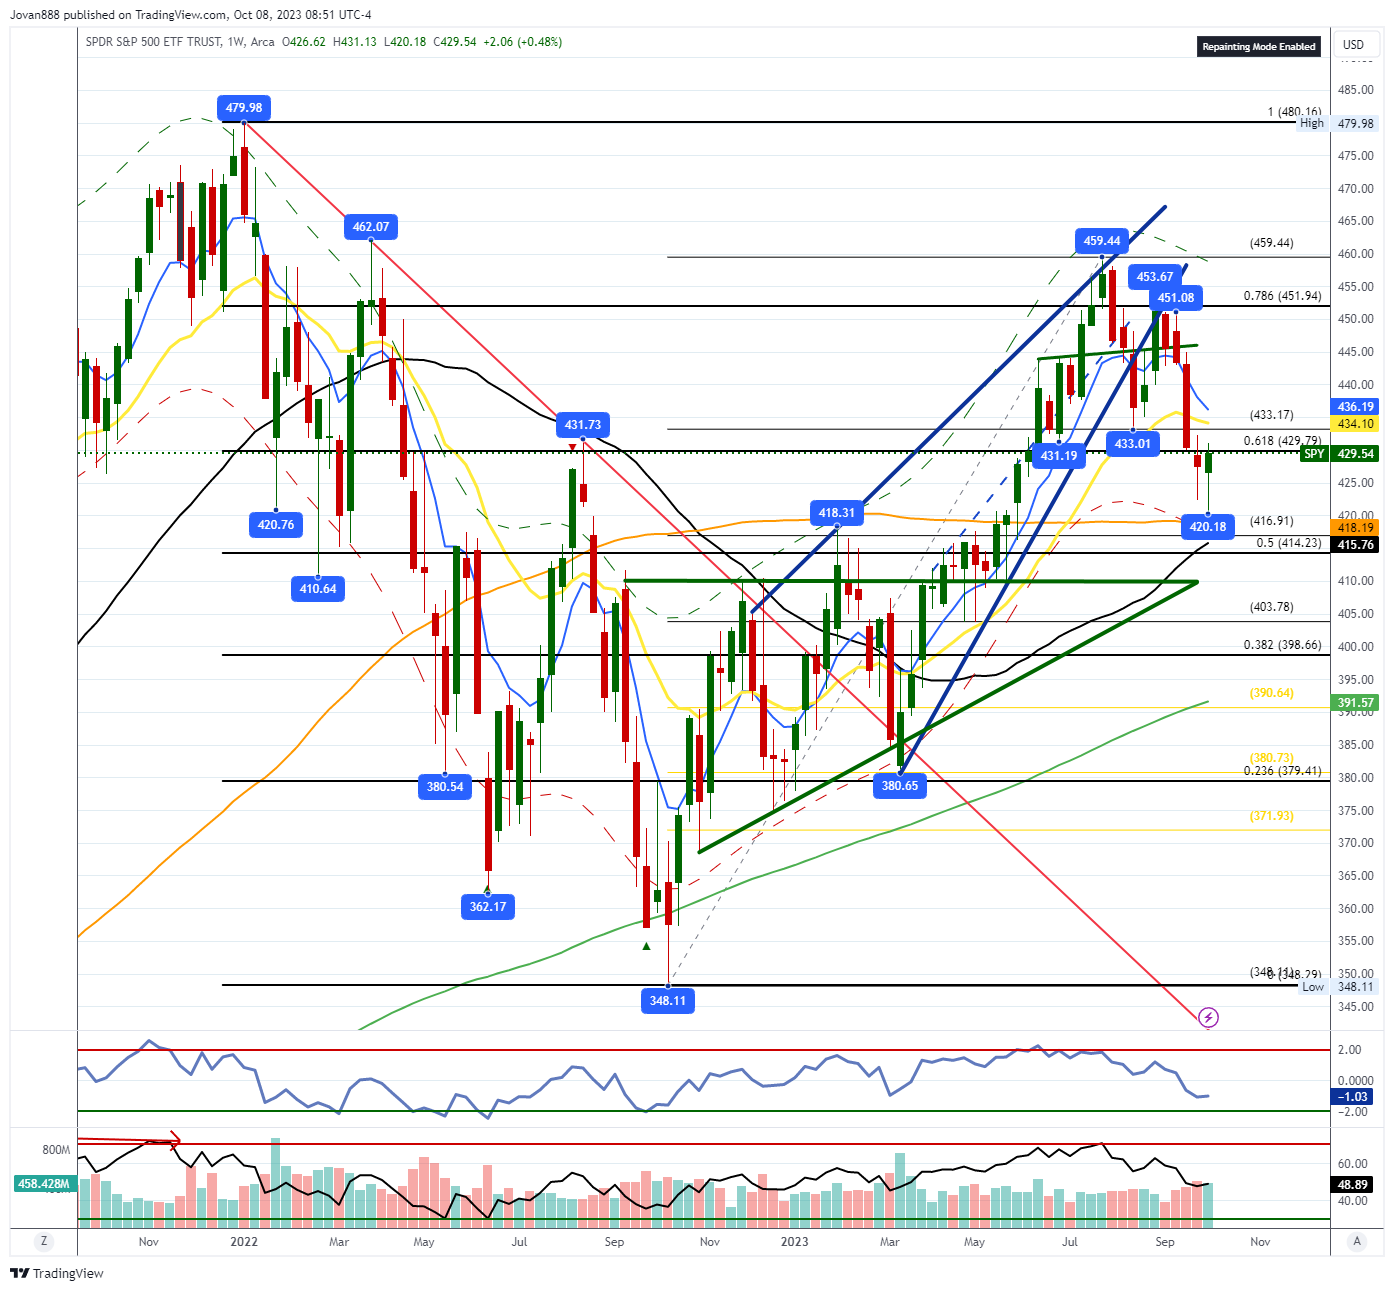
QQQ 0.00%↑
QQQ daily chart tells a different story than SPY. It’s bull flagging on the daily for now. QQQ definitely displaying more strength relative to SPY and it filled it’s bear gap on Friday.
QQQ weekly chart… if you are a bear this chart looks very concerning.

IWM 0.00%↑
IWM appears to be the weakest of the 3, however it did put in a bullish divergence on the daily chart this past week.

IWM weekly chart shows the H&S was within a larger bear pennant which has started to break down.

In summary, QQQ is the strongest of the 3, SPY is in the middle and IWM is the weakest of the 3. Each is experiencing a different reality of the current market situation.
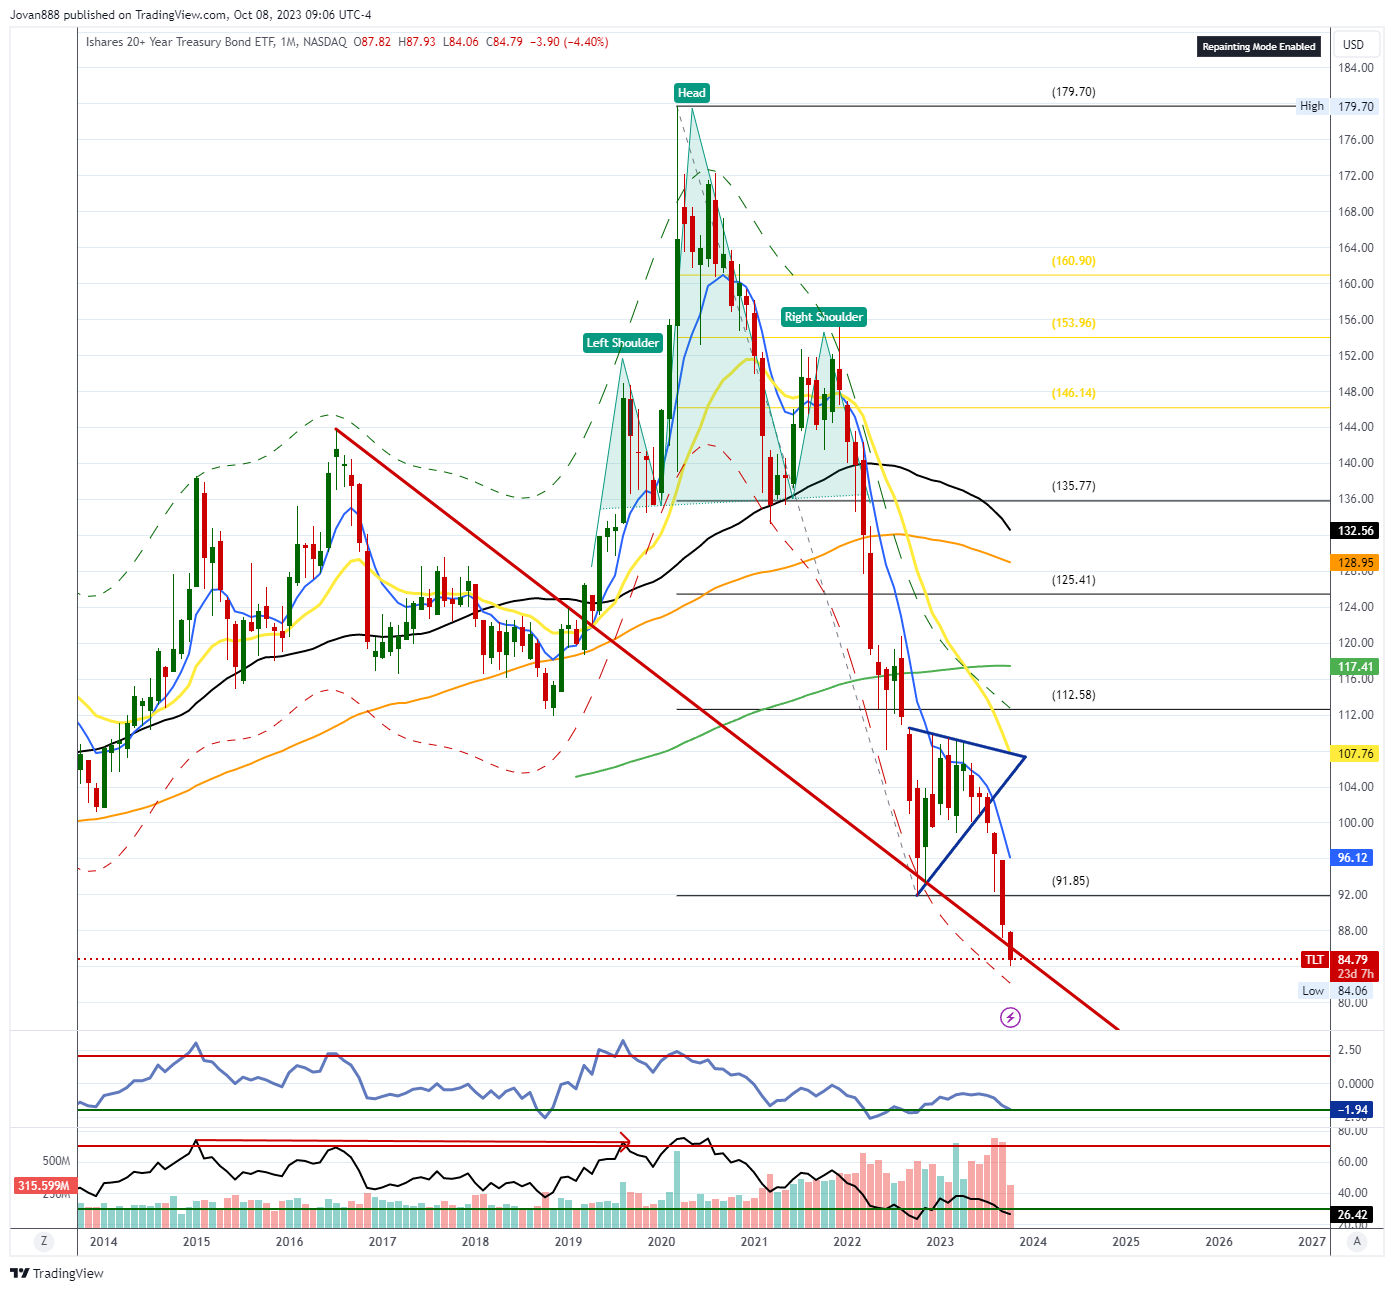
Something else to keep in mind will be TLT 0.00%↑ which has been the weakest of all and the divergence gap between QQQ and TLT continues to increase.
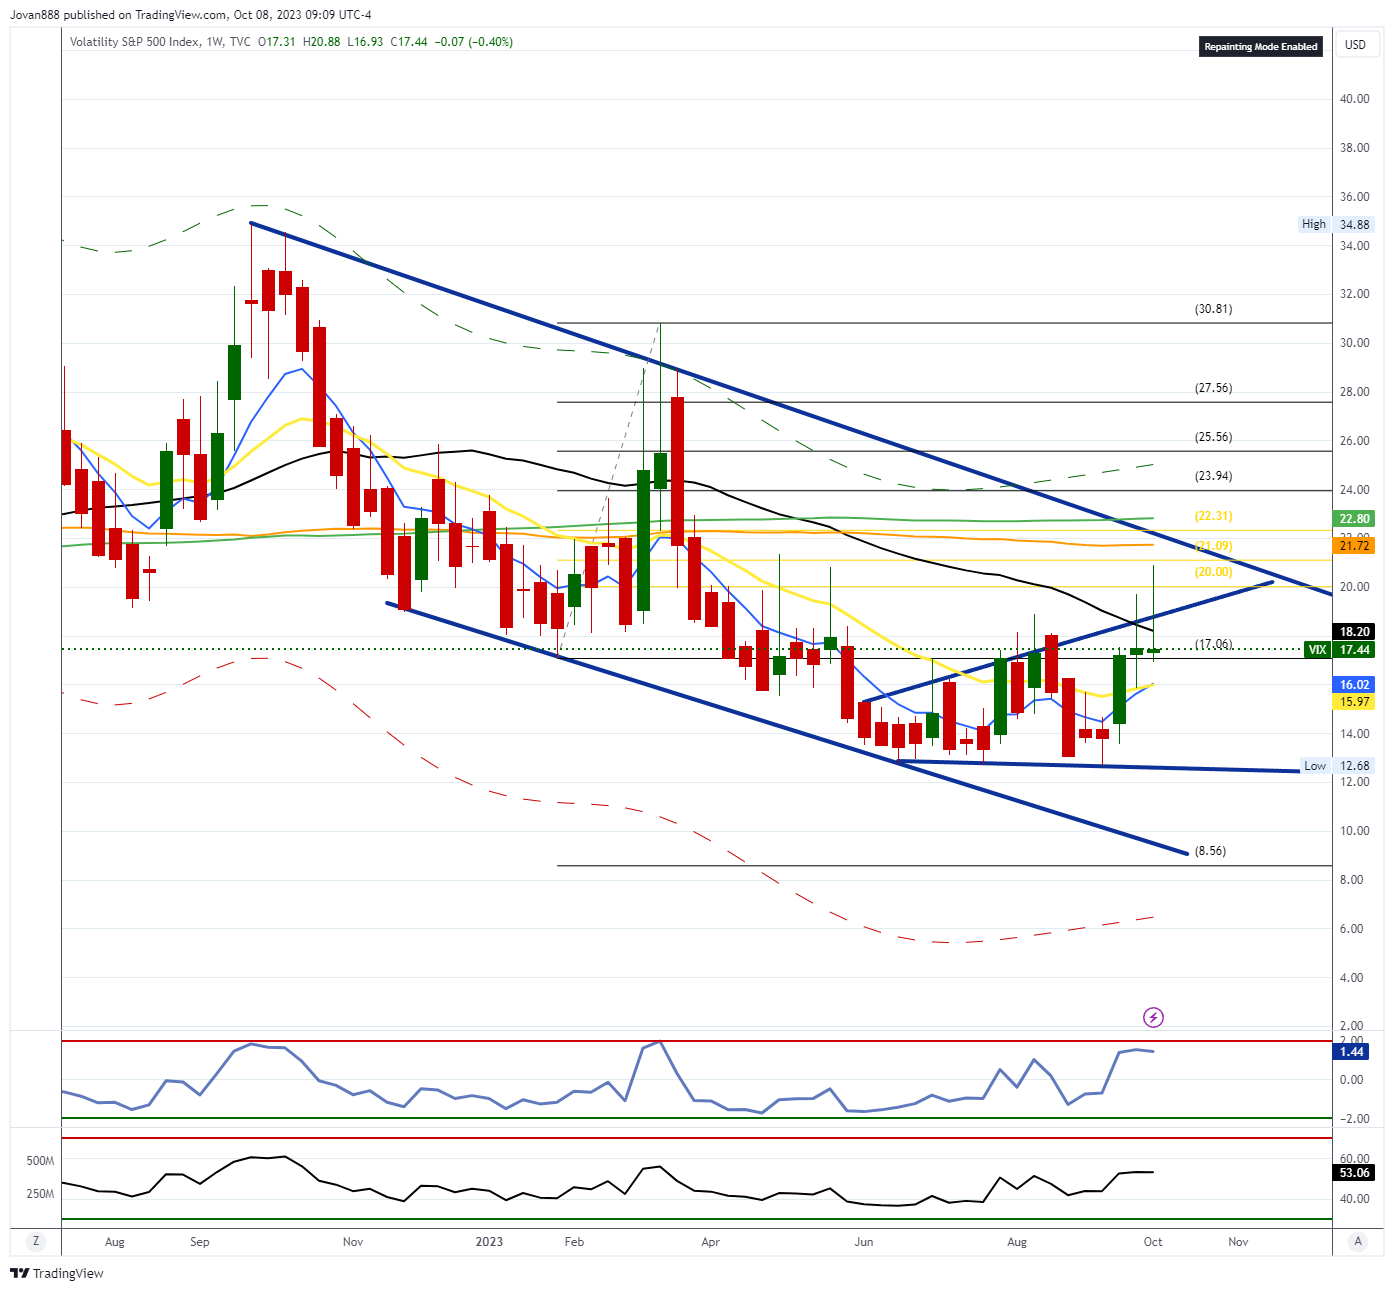
$VIX - in a broadening wedge since June - 8/50 on weekly getting closer implying a big move coming soon based on the reaction
We remain in “fear” on the Fear & Greed Index even after the green weekly close from last week. We are no longer in oversold conditions in shorter timeframes. AAII survey shows increasing bearishness at the lows.


Here is the economic calendar for next week:
CPI on Thursday

For this upcoming week I will be watching the following setups and levels:
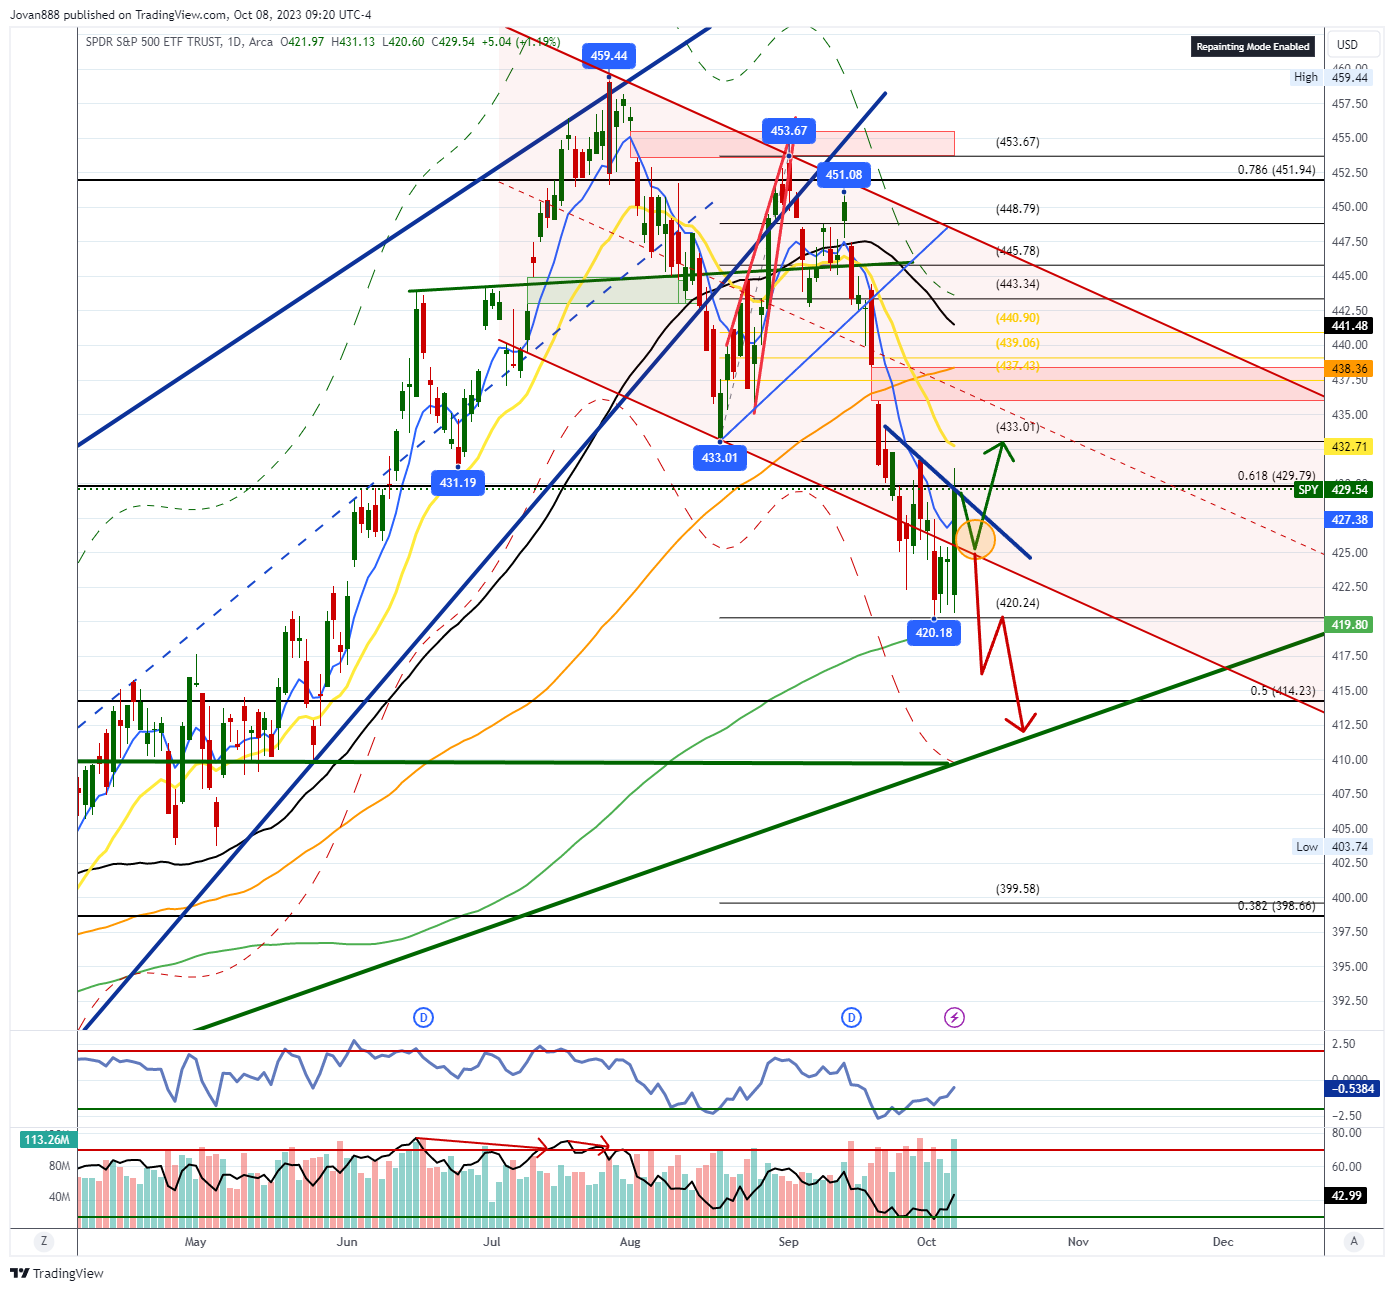
SPY 0.00%↑
Clear downtrend in bigger picture with lower highs and lower lows. Due to the nature of Friday’s rally it’s possible we see a retest of 427 level before deciding next move.
Bull case: Over 429.79 can see an attempt at 432-433 again before a sell reaction and then attempt higher into 436-438. Bulls must hold 427 on any dips or risk a retest of 424 which can open the door to lower lows / rug pull.
Bear case: Bears will need to get closes under 424, preferably a couple daily closes or the week under it for a test of the 200sma at 419.80. It will then need to break that to target 414.23 level and overshoot down to the weekly trendline at 411.
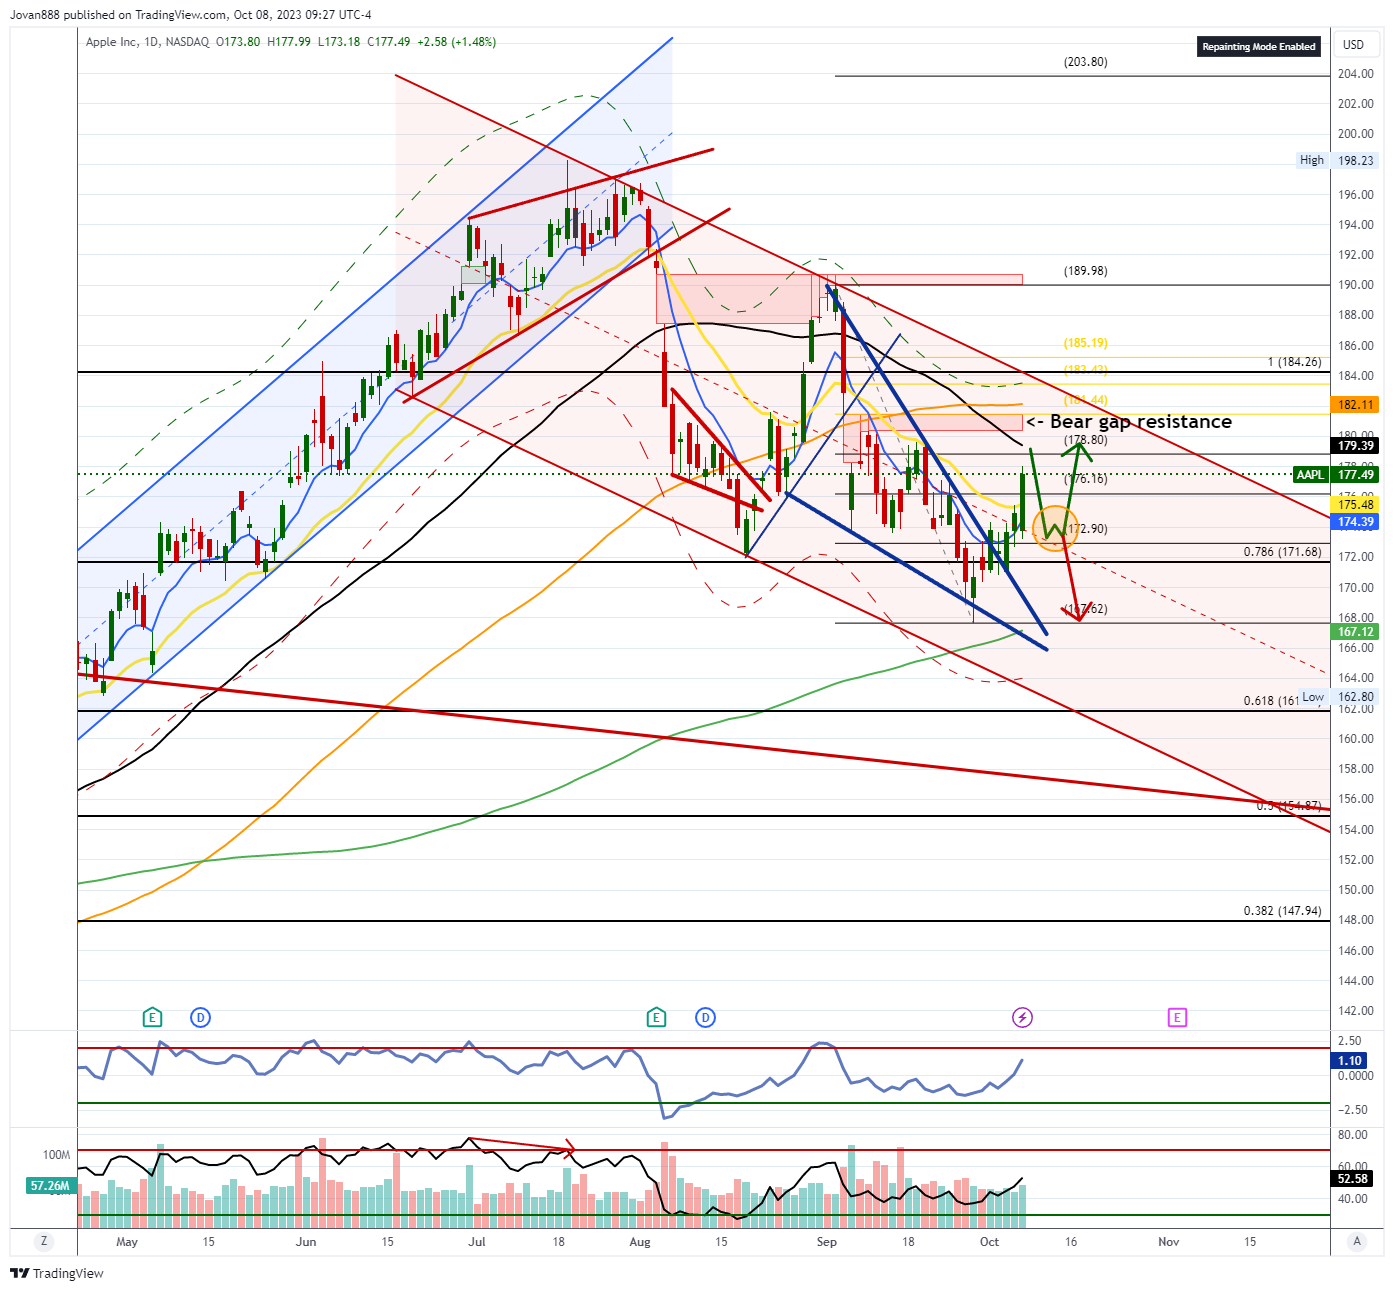
AAPL 0.00%↑
Falling wedge breakout, volume wasn’t all there for the move, 50sma and bear gaps above as resistance, needs stronger pattern to overcome. Possible retrace to 173 to form an IHS and build energy for that type of move.
NVDA 0.00%↑
Higher lows on NVDA and higher highs is still the trend.
As long as 445 area holds this can target upside of broadening wedge at 467-475.

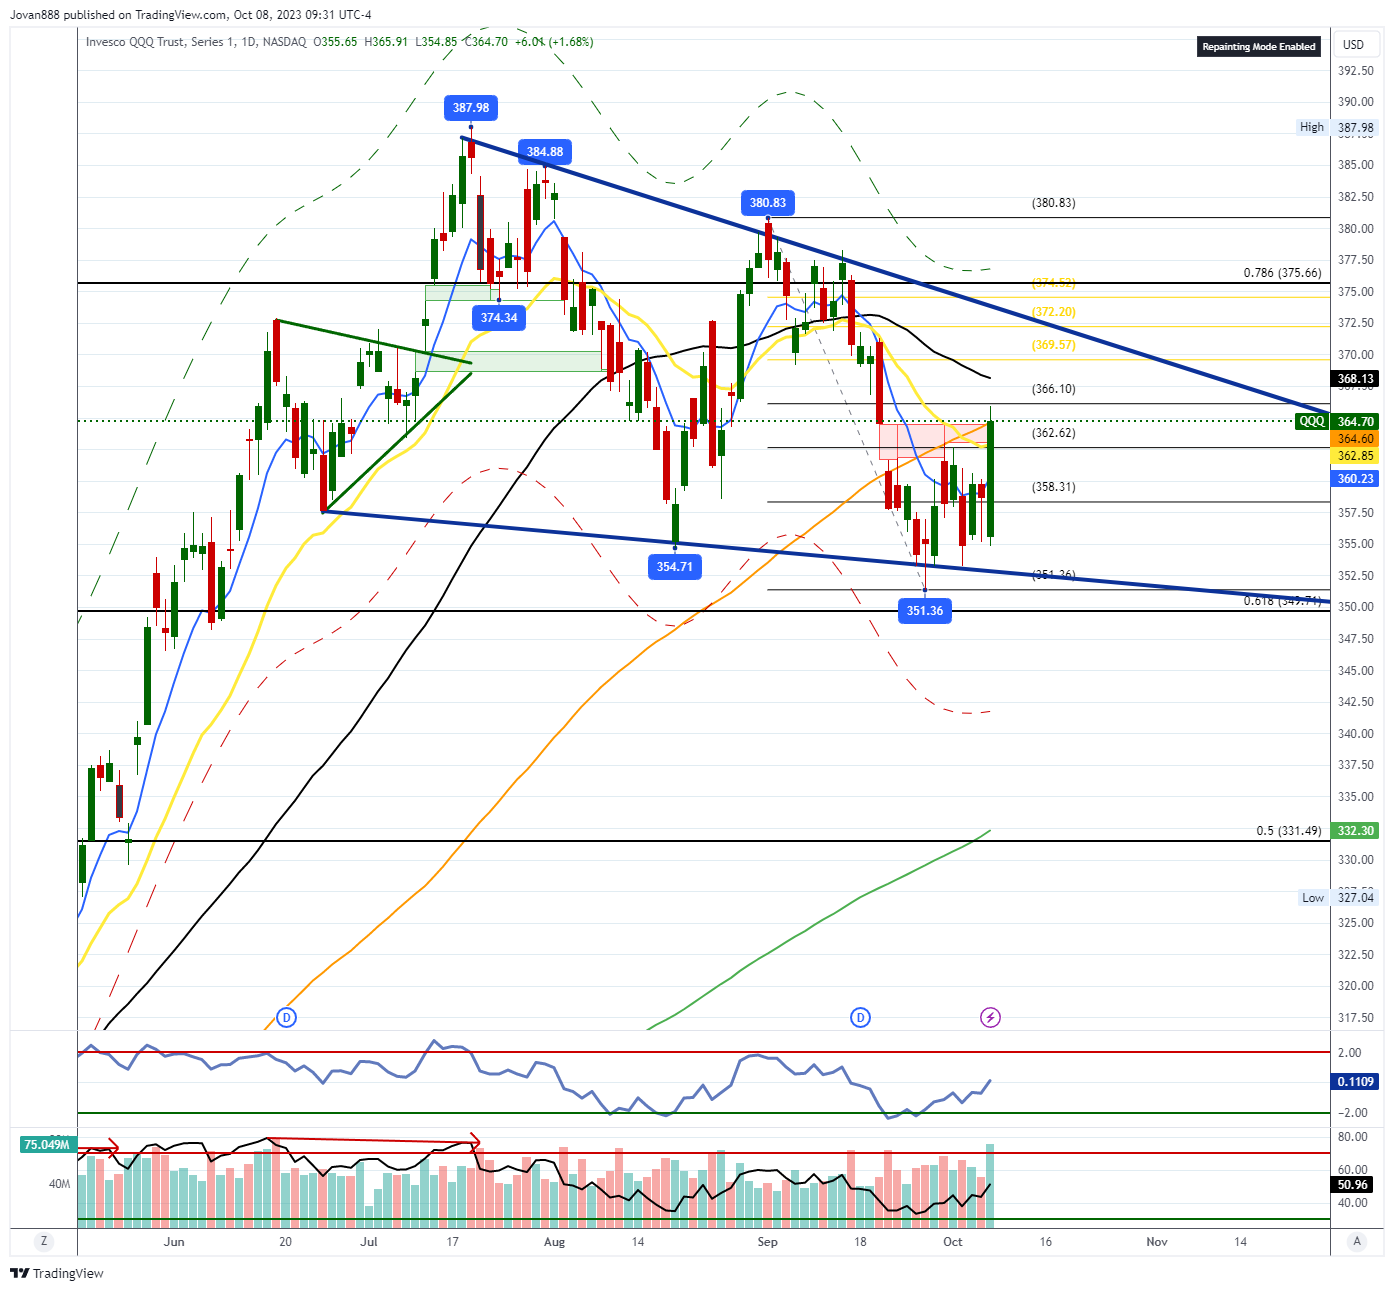
QQQ 0.00%↑
>366 target 50sma 368.13 and then golden pocket at 372.20
<366 possible retest of 362.62, possibly 360.23, as long as that holds still bullish.
No real bear case here unless 355 falls then it’s a retest of lows at 351 but bears will need to take out that 349.71 for any meaningful sell, at that point it would be to 338 level.
TSLA 0.00%↑
PENNANT structure here with higher lows and lower highs.
265.97 key level for bulls, it will need to break that for a move to 272-280 and test the bear gap at 289.52 and then 295. (upside breakout of pennant)
For bears, They will need to take out 230 level to target 221.26 and then 200sma at 208.33

FOR A LIMITED TIME: OUR DISCORD MEMBERSHIP IS $44/MO OR $440 FOR THE ANNUAL. YOU CAN JOIN HERE: JR88 DISCORD Membership Plans
GOOGL 0.00%↑
Wedge breakdown failed - obvious strength.
Dips may be supported on this one, I noticed 150C flow out a couple of months
Interested in buying dips as long as 127 holds to target 151.55. (longer term)

AMC 0.00%↑
AMC finally starting to coil, watching this one if it can get above $10 can start a move to $14.

META 0.00%↑
Last week I mentioned that If 300 remains supported this may head to 313-316 area next. We tapped that level to the penny before Friday’s close.
Volume to me wasn’t exciting for a breakout of this magnitude, I am watching now to see if dips to 307 are bought for continuation. If we start to see a few closes over 313 then we can setup a move over the next few weeks to 326-333.
No bear case here unless we start to go below 298.

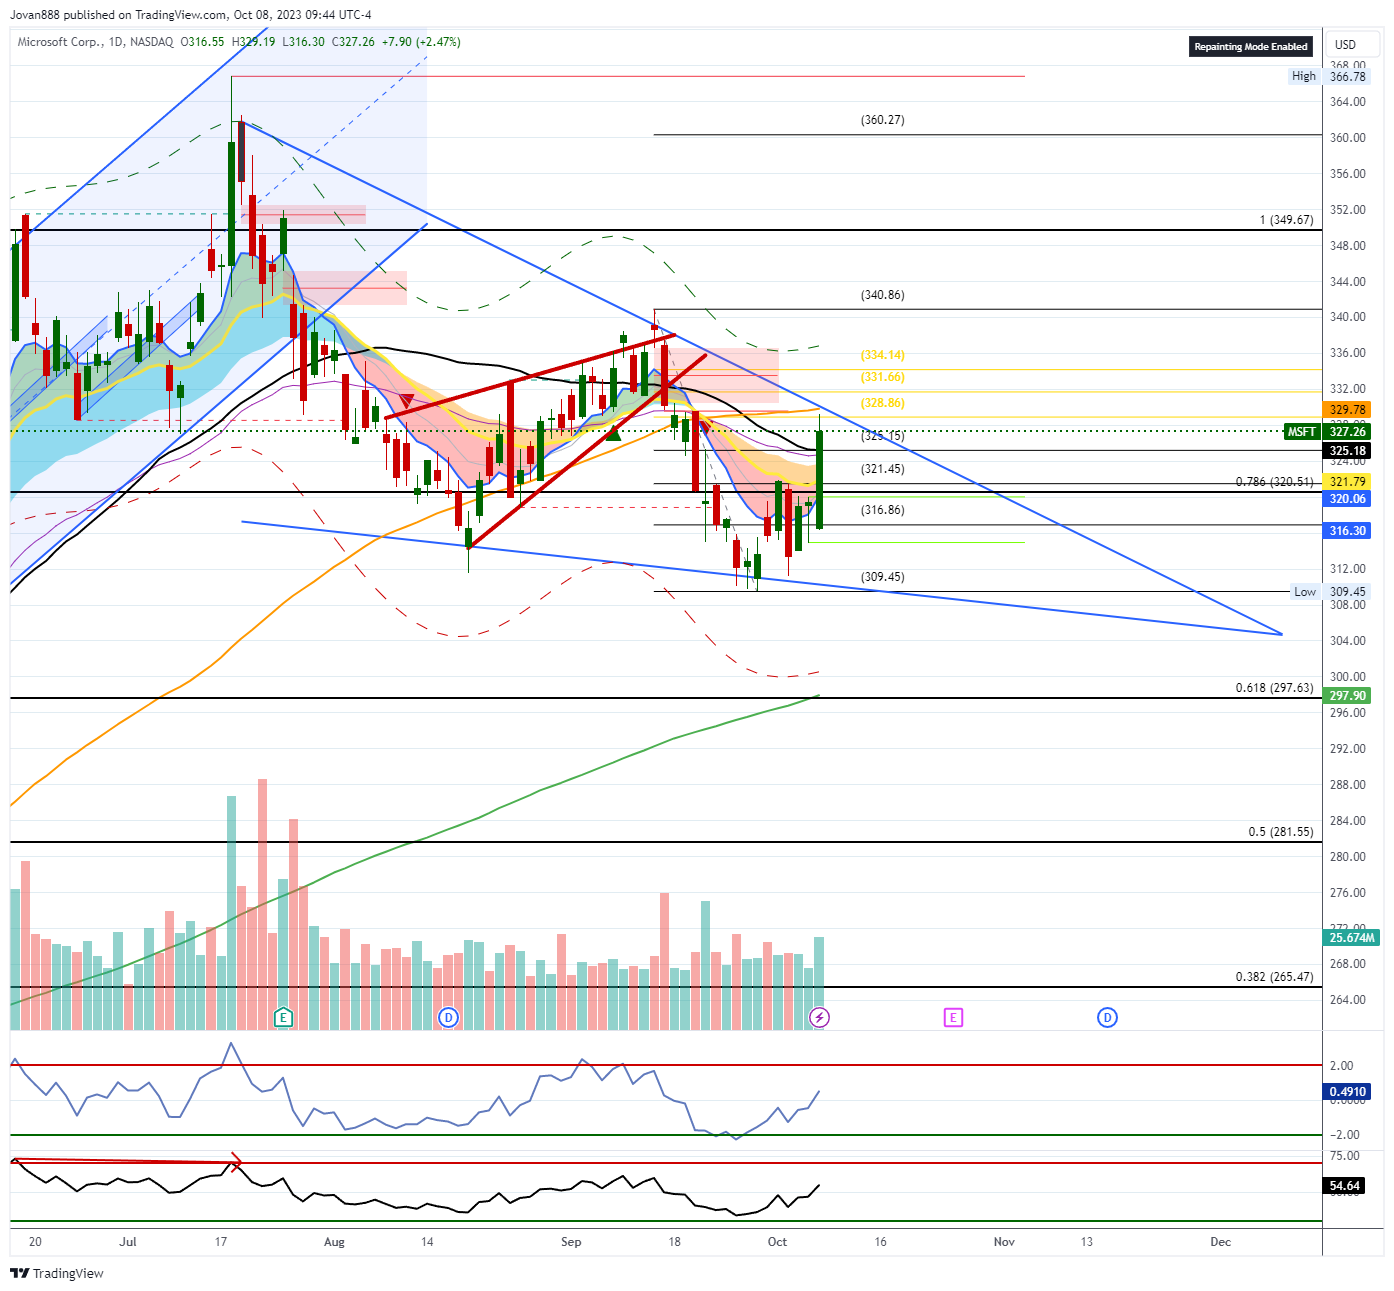
MSFT 0.00%↑
Falling wedge building out in bigger picture, needs more time.
If it can clear 331.66 with volume, then we can breakout to 340 and 349.
If it gets below 320, we can explore the lower end of the wedge again near 308
AMZN 0.00%↑
Watching 130 level - if it clears, we can see a squeeze into 135.
Not too interested in a short unless 122 level falls - which would be a short trigger for a move down into 113

SE 0.00%↑
This one I posted back at $37, I think as long as $40 level continues to hold we can retest the 50sma at 44.23. For a breakout we will need to clear $45 at which point we will target $52.80.
This bullish setup fails below $39

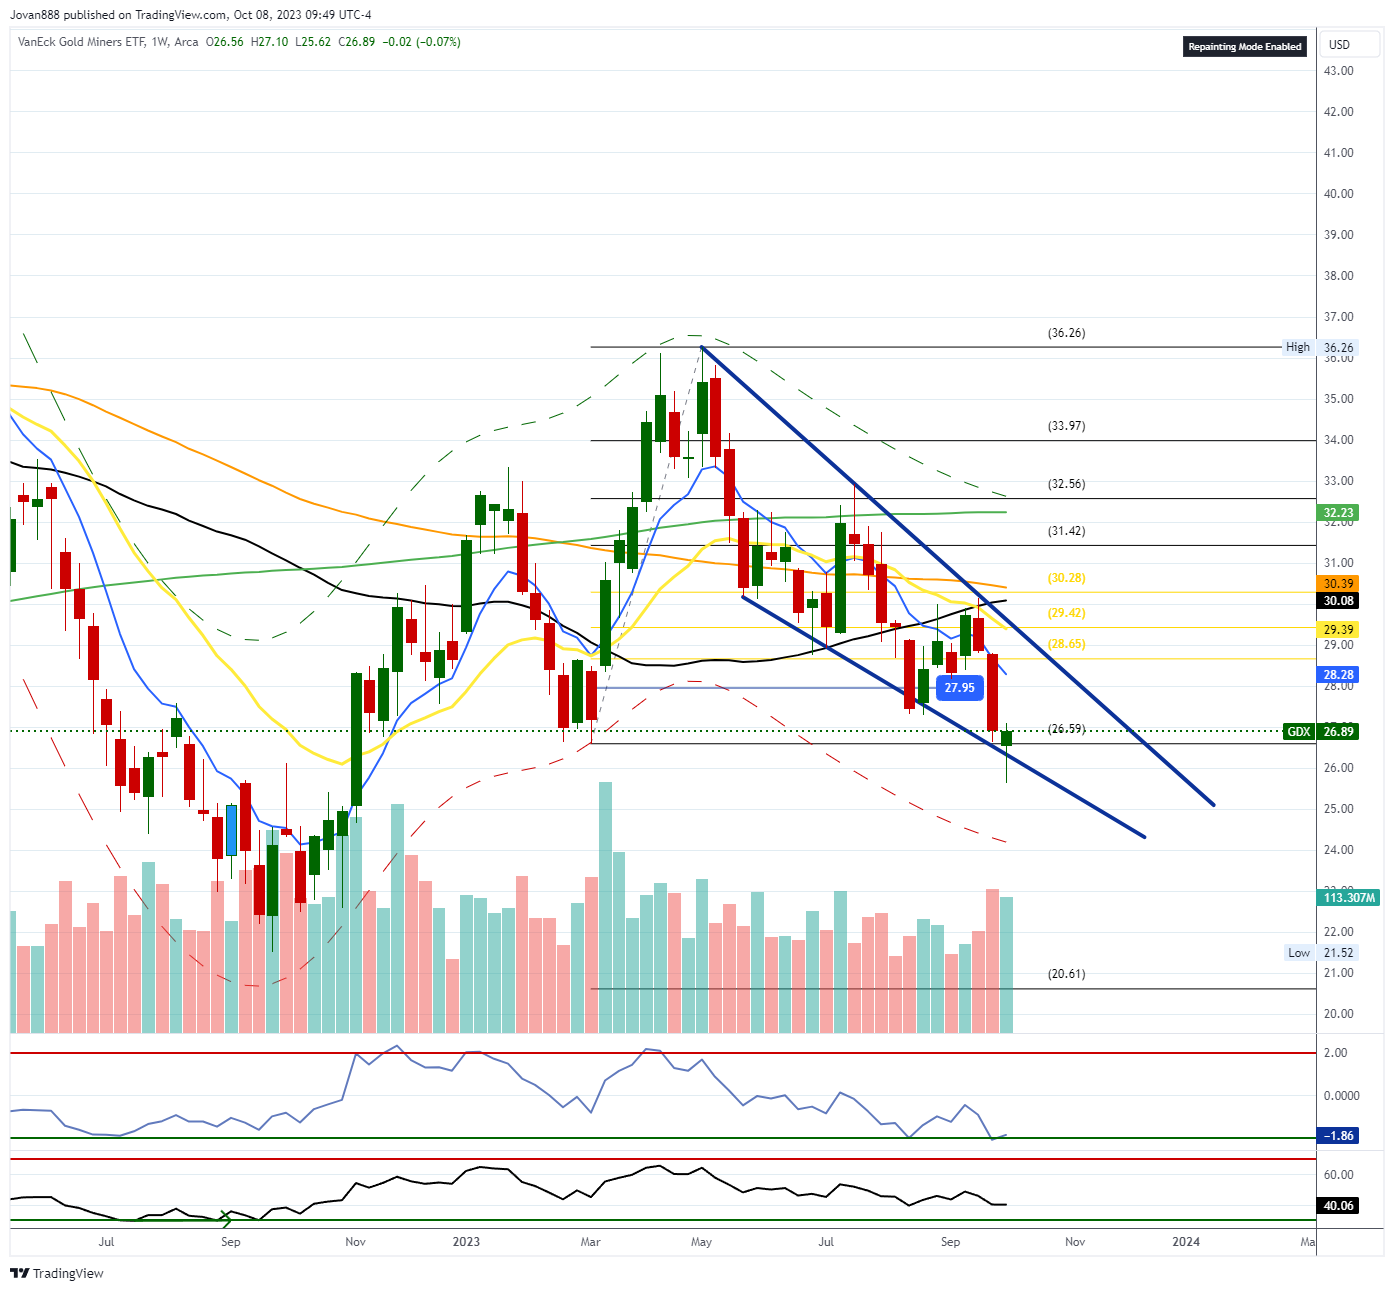
GDX 0.00%↑
Hammer on Weekly for GDX. I think as long as we hold this 26.59 level we can retest the top of the wedge around 28.65.
GS 0.00%↑
Possible breakdown here, we need to see if we can close below 320 this week, if we do, this may be the start of a breakdown towards 264 level.

NFLX 0.00%↑
$368 will be key, if we hold above that this week we can move back to 400, 408, 416.
If $368 falls then 344 may offer support.

FOR A LIMITED TIME: OUR DISCORD MEMBERSHIP IS $44/MO OR $440 FOR THE ANNUAL. YOU CAN JOIN HERE: JR88 DISCORD Membership Plans
IF YOU HAVE CHART REQUESTS OR QUESTIONS PLEASE LEAVE A COMMENT, THANK YOU!
Have a wonderful weekend!
Wishing you a successful and profitable trading week ahead!
Best regards, Jovan