

Hi everyone!
Due to the rolling of ES contracts and levels constantly changing, I prefer to use $SPX levels in the newsletter as they remain constant and avoid confusion. Last week I gave 4541 on $SPX as the pivot and point of control for this week. I also mentioned that even for the bullish count, a pullback was likely as price was too far away from the 8ema which is a common magnet for price. I mentioned that as long as we were below 4541 it was very likely to see a retracement to the 8ema at 4471. We started the week at 4510 and we never even got close to 4541 - so the pullback case had begun as of the first day. The range for this week was 4514 to 4430 and was an inside week to the prior.
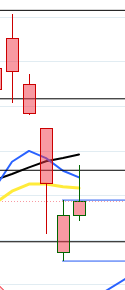
This was the price action for the prior week on the last newsletter, and the 8ema I am talking about is the blue line below:

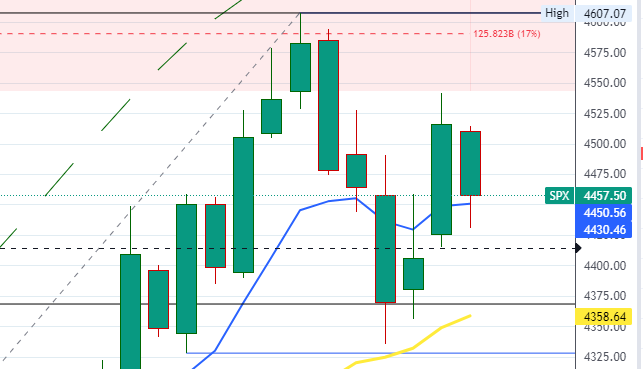
And here is the price action for this past week
As you can see, this type of move, when seen on a daily chart, usually is the first sign that you are stretched to the upside (or downside in reverse) and that you should be prepared to retrace to it. This is something I use along with other indicators to guide me as to the current market trend. Here is the past 2 months where you can backtest this same concept and you can use it to help you on your trades:

The 8ema is a great indicator for momentum - if you are consistently closing above, it you are in an uptrend, if you are closing below, it you are in a downtrend.
From last week’s newsletter:
Key Levels: 4541 & 4439
Bullish but pullback first - Trajectory: If we are under 4541 it is likely that there will be a retracement to 4503 and then the moving averages and fib cluster at 4471.
Bear Trajectory: Bears will need a few closes under 4471 for this to develop a bear case. Bulls are firmly in control here above 4471. If bears manage a few closes under 4471 then this can unravel rapidly to 4399, 4335, 4232.
This past week was an inside candle - similar to two weeks ago before the large upside reversal move. As you can see, we have traded in this 4325 to 4600 range now for 3 months. SPX is building up energy for a large move. Based on the timing of this it does appear a large move will begin by the end of the month.
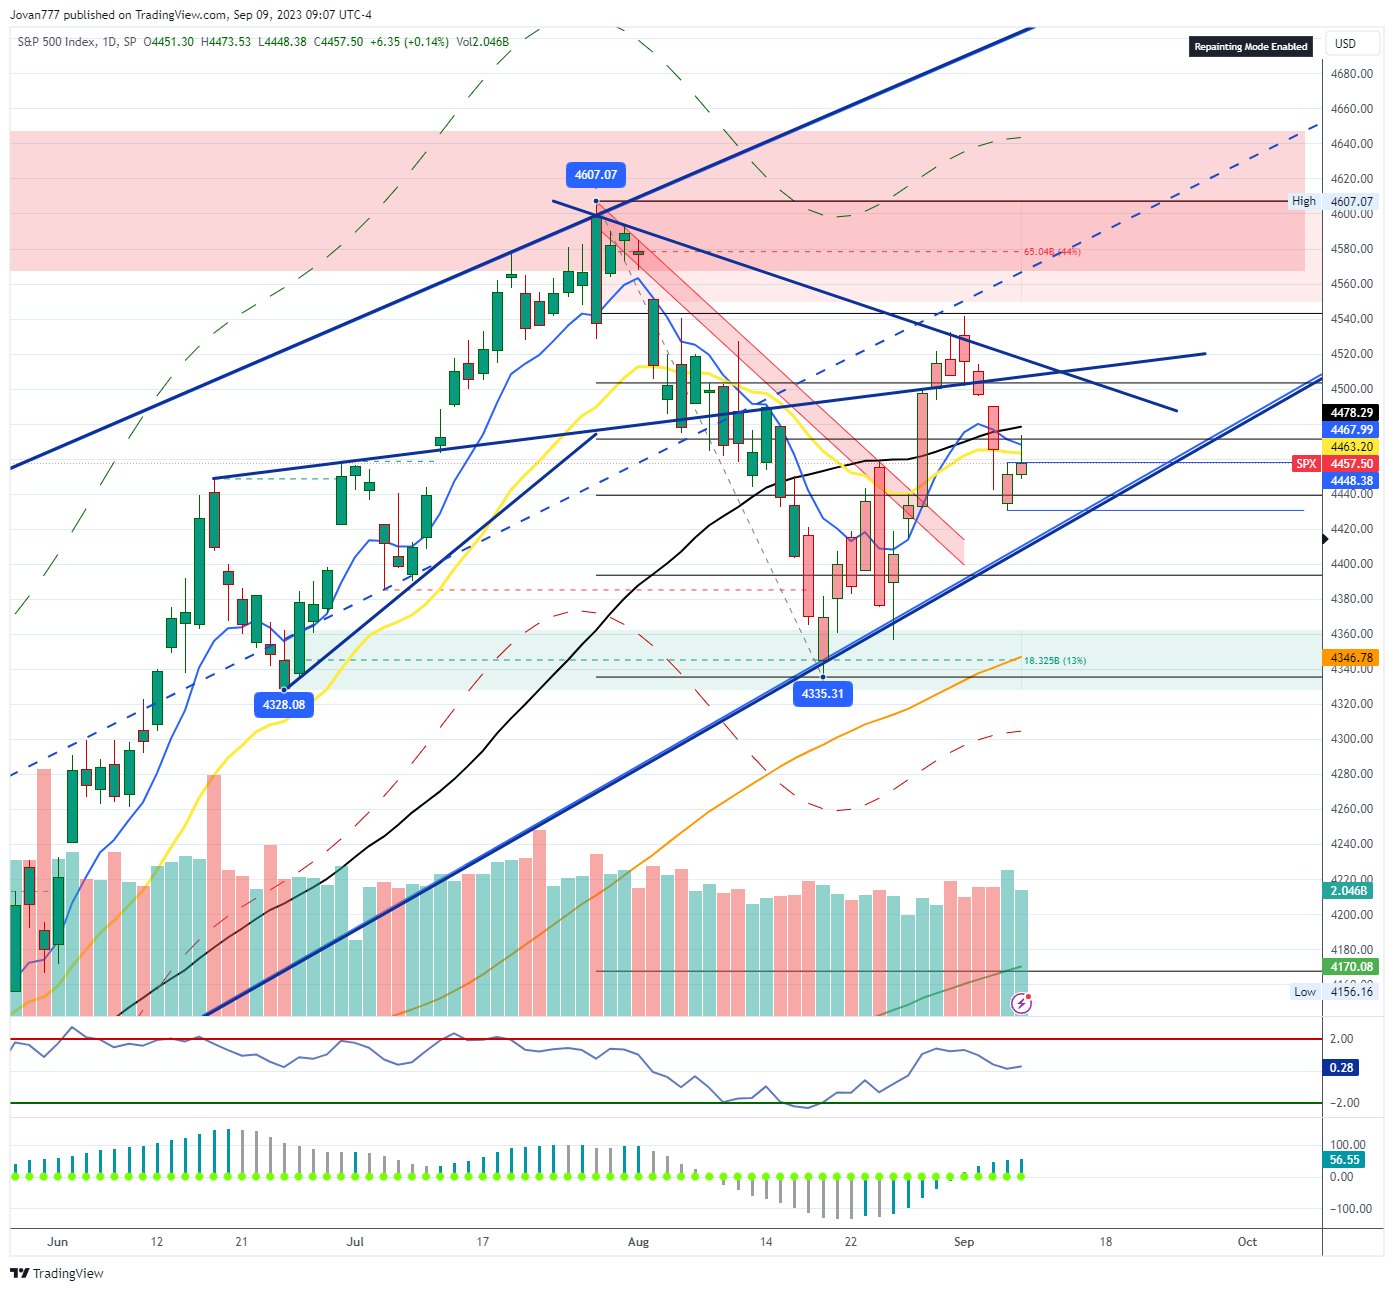
There is a chance of course that we set a lower high at 4541 and that’s something everyone should be watching in the next two weeks. My main concern here if you are a BULL is that the 8ema and 50sma failed to hold on this move down and the 8ema has again crossed under the 50sma indicating that momentum is to the downside. Below 4503 on SPX the bears can push us lower into 4414-4420 and 4393 for the bulls’s last stand, where they must come in otherwise, we will retest the recent lows at 4335 and see if it breaks or holds.
SPX Analysis:
Key Level: 4471
Bullish Trajectory: Bulls will need to take out 4471 to retest 4503. That will be the bear’s last stand and likely some major dips there. They need to take out 4503 to reclaim control and shift momentum back to the upside to then target 4542, 4567, 4607 and 4637-50.
Bullish but pullback first - Trajectory: Below 4471 pullback can continue to 4439, 4414-4420 and 4393. As long as this holds - we can set a higher low and then continue building for more upside.
Bear Trajectory: Bears remain in control below 4471. They need to push us below 4430 again to target 4414-4420 and 4393. 4393 must fall for further downside into 4356 and 4335. The 100D SMA is at 4346.78, so that will need to be taken out for sell into 4241 and 4170. I’d expect that 100D SMA if we get there to be a good knife catch spot for a bounce on the first test. Same for 4393-4400 area.
I am watching what looks like a bear flag setting up under the 50sma:

Basically we are basing below the 50sma gathering energy for the next big move. Either that’s to breakout of this pennant or to retest the 100D SMA below. This means Monday we likely have a green day to complete this flag, and possibly chop into CPI where then we will get our real move.
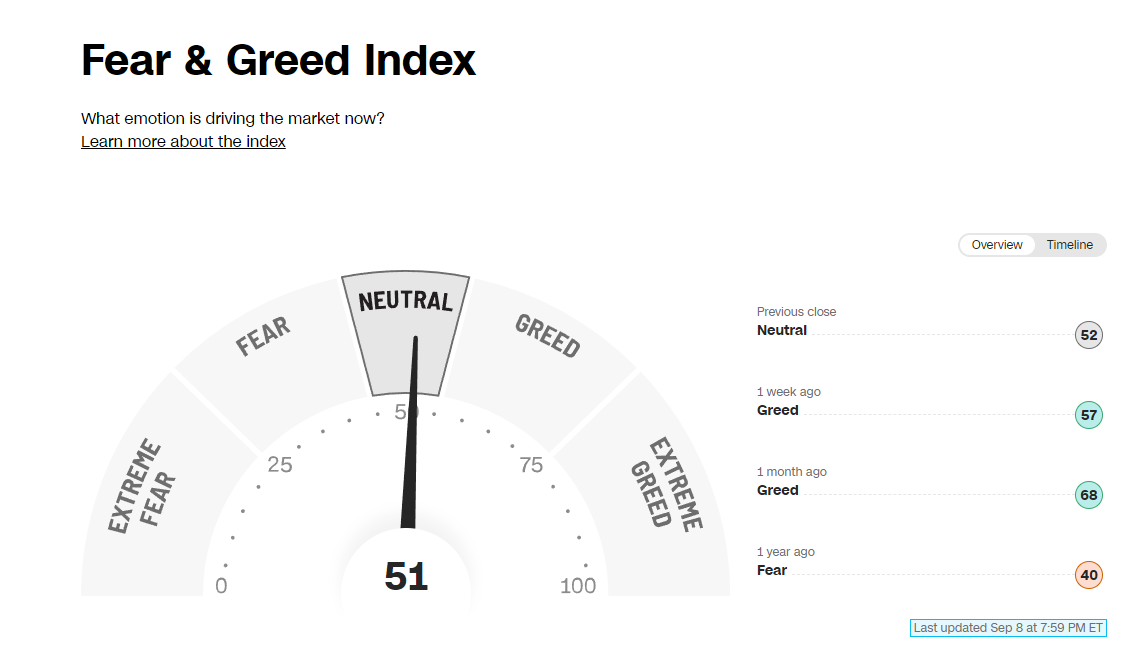
We have gone back to “neutral” on the F&I essentially giving us the “reset” we needed after the parabolic rally we had in the summer. Now we can setup the next large leg with plenty of room.

AAII sentiment however, after last week is overwhelmingly bullish - but not yet at the 1 year highs. It’s not what I would want to see if I was a bull right now, as we are under the 50SMA in a bear flag…
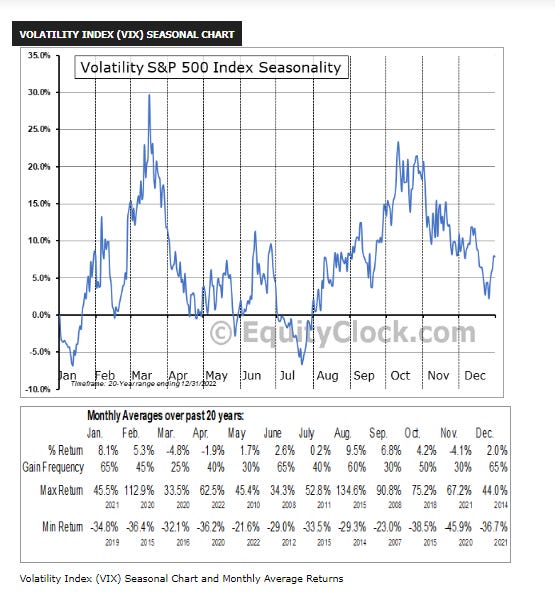
A reminder of the VIX seasonality:
Here is the economic calendar for next week:

For this upcoming week I will be watching the following setups and levels:
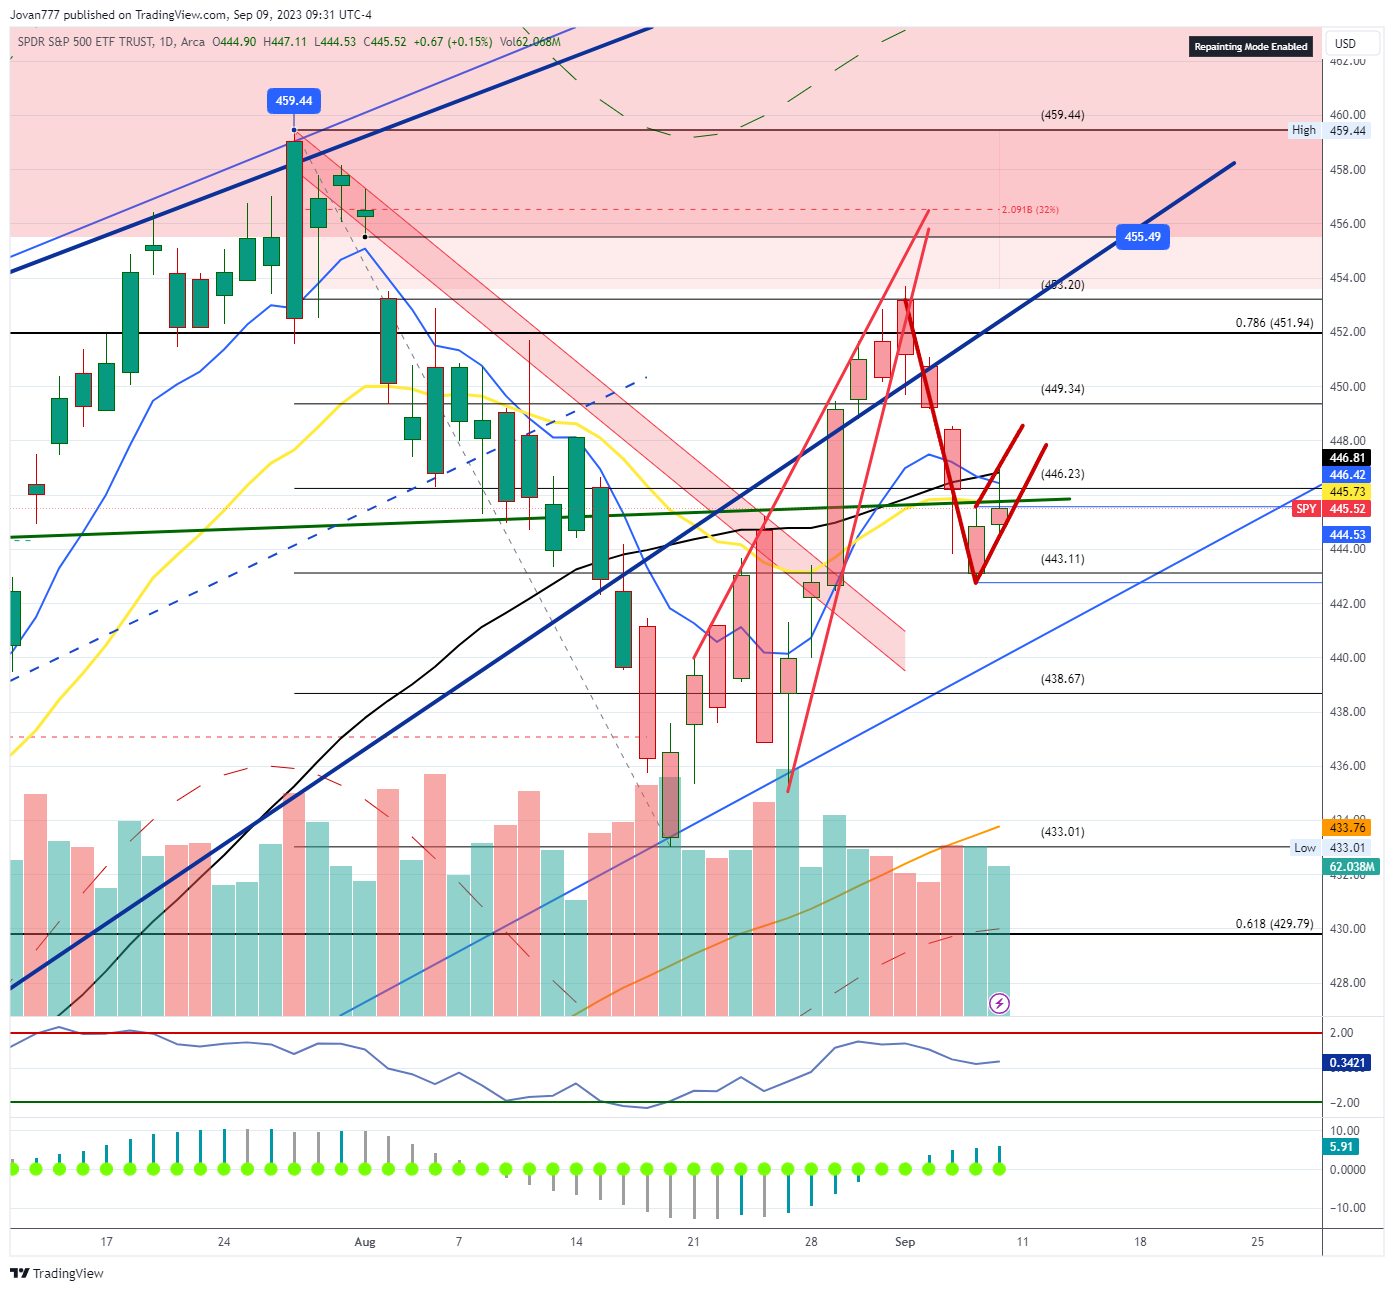
SPY 0.00%↑
Key level for the week is 446.23
Bull case: Above 446.23 we can continue filling out the bear flag and try the gap fill at 449.24 and fib at 449.34. If they can close over 449.34 the bear flag is invalidated and they can attempt 451.94 again. Above 451.94 is 453.20 then gap fill at 455.49
Bear case: Below 446.23 can retest 443.11. Bear flag fires below 443.11. Below that is a test of 438.67-440 area. Below that is 100sma at 433.76 and recent lows at 433.01
Note: This is a bearish consolidation pattern formed after a breakdown of a prior bearish pattern. A rising wedge that broke to the downside followed by a bear flag.
AAPL 0.00%↑
AAPL is in trouble here after losing its reversal uptrend. Failure to close such a large gap quickly is also bearish and the 8ema/50sma crossover failed with both moving averages curling down. There is the possibility of the gap at 181.47 being filled however as long as AAPL is below the gap at 190.69 the structure is bearish and pointing at a move to 164.04 to the 200SMA.
Possible trade idea: Scalp calls to 181.47 if market is green on Monday, then switch to puts on any sharp rally ahead of AAPL event - as 8ema, 21ema and trendline backtest resistance are all at the same place and 181.47-182.94 should give us a good short opportunity to targets 177.58, 171.96, 170.36 and 164.04.

NVDA 0.00%↑
Uptrend is broken - bears in control now below 470. Watching the 8ema above and the 50sma below. If NVDA loses the 50sma at 451, we can sell down to 441, 426 next. If the 8ema crosses under the 50sma, we could see accelerated selling into 403 and 395 for the 100D SMA test.
No longs here unless above 490 for me.

Key level for the week: 380
Above 380 is a bullish setup to 388 and 400 (IHS firing)
Below 367 is a bearish setup to test the 100D sma at 355.80
Now 372 - watching how this develops next week.

TSLA 0.00%↑
Key level: 242
Consolidating in a bull pennant on daily. 242 must hold for bulls.
Bull case: Above 258 targets 261, 266, 272, 289 (gap fill) 294.
Bear case: Below 242 targets 236, 231, 226, 222, 212, 204.

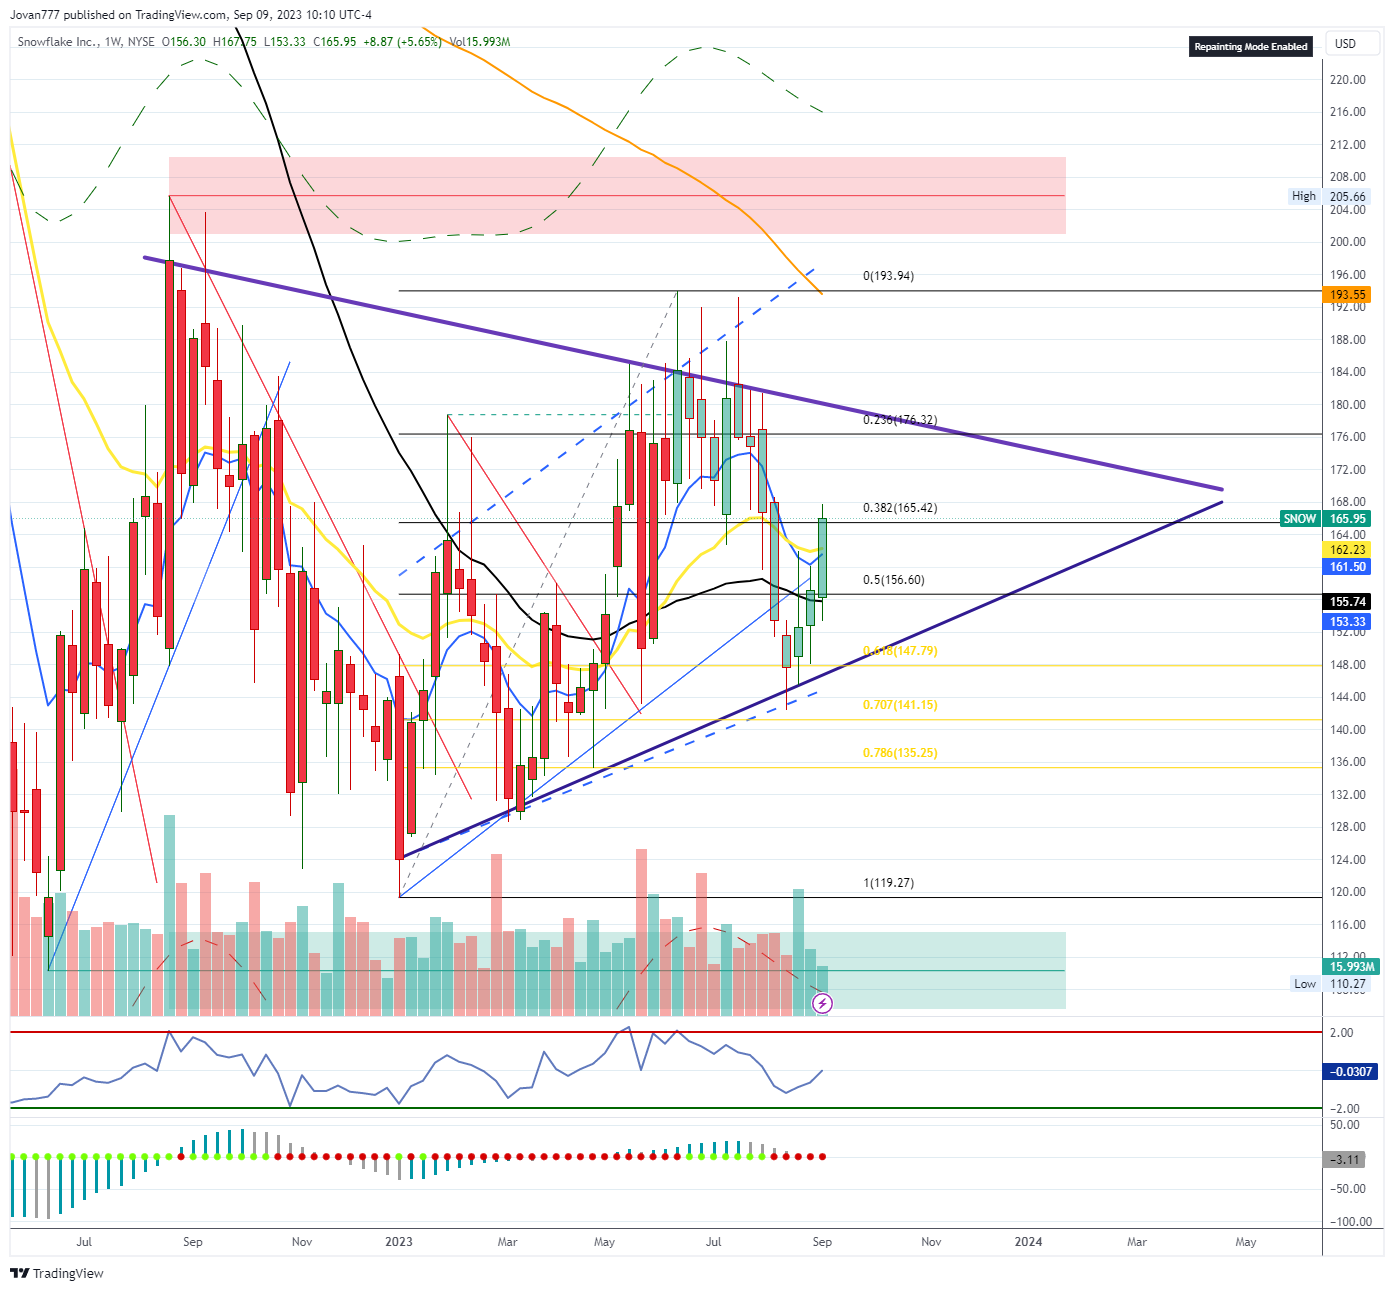
SNOW 0.00%↑
Bouncing off bottom of pennant
If it holds 165 can see a move to 476 to test breakout, where it needs to clear for a move to 194.
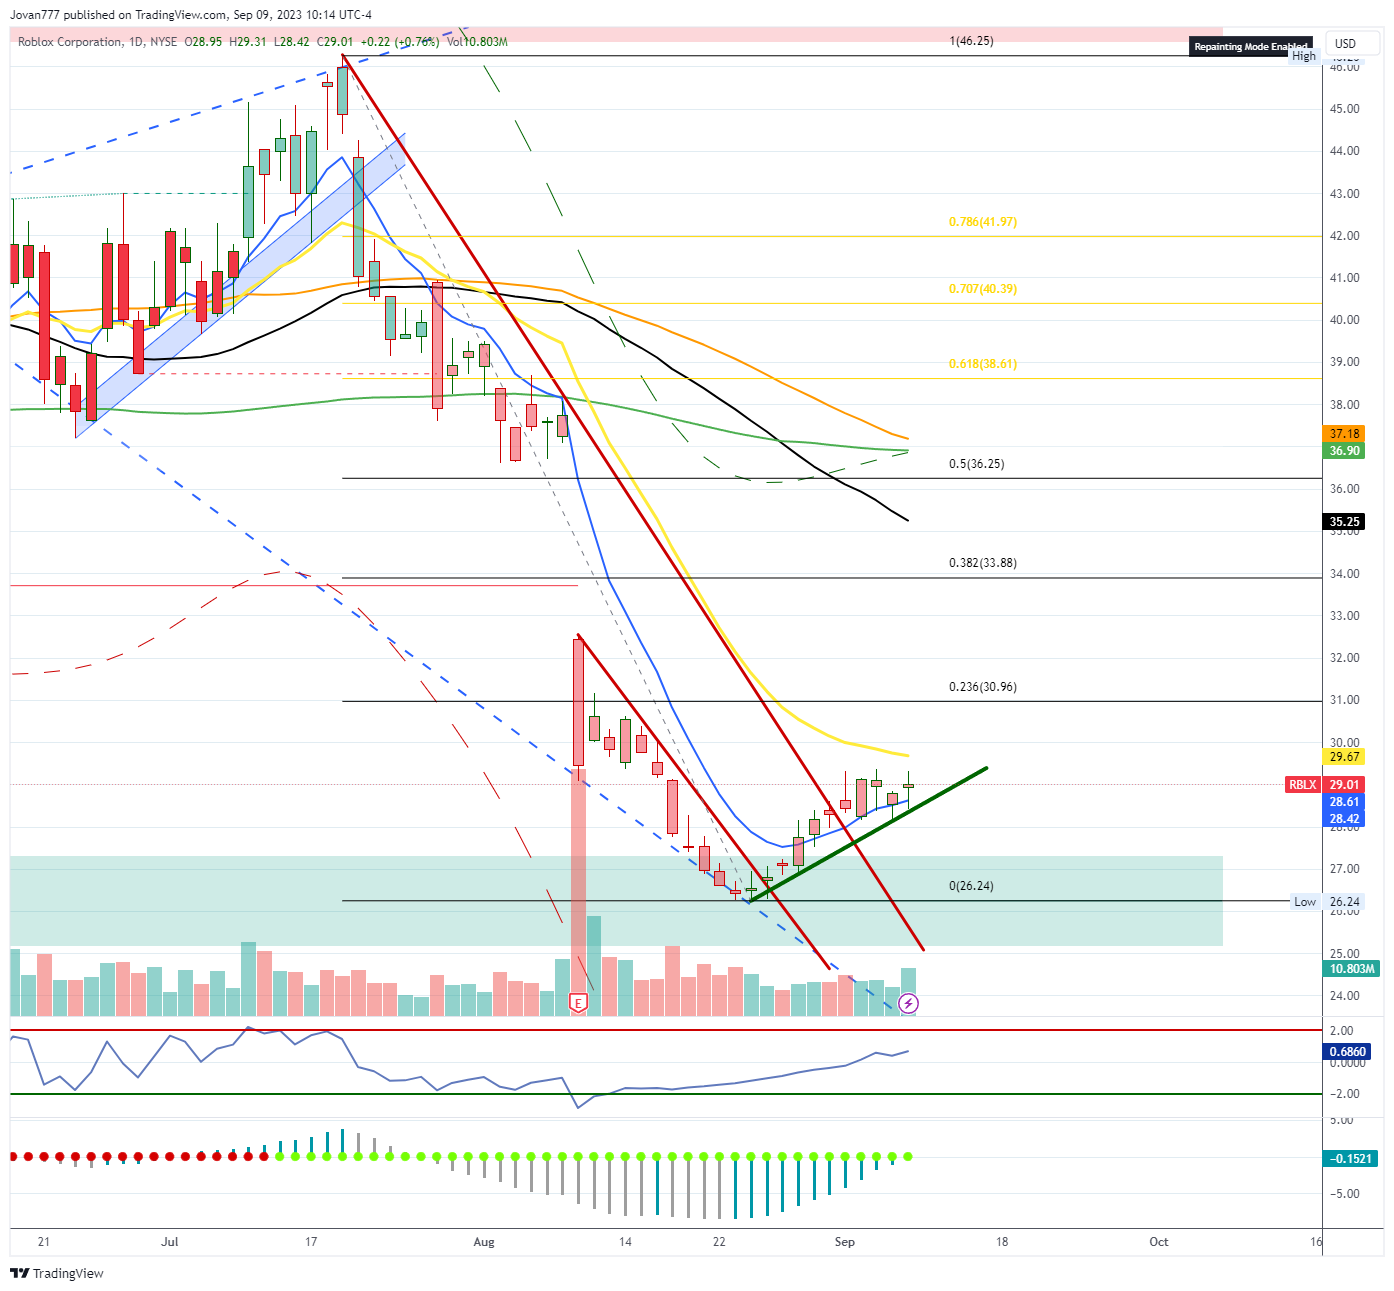
RBLX 0.00%↑
Has gained support on the 8ema and building energy to test the 21 ema at 29.67. Need to see the 8ema cross over the 21 for a move to 30.96.
GOOGL 0.00%↑
Relative strength as rest of market pulled back. Looking like we will test 140 however this is in a rising wedge so urge caution as pullback likely to follow after hitting 140-142 area.

XLE 0.00%↑
Keep running stops up - breakout fully active above $84, looking for 94-95

META 0.00%↑
Bear flagging on weekly with $280P flow for SEP 29.

MSFT 0.00%↑
Over 337 is a setup to 349
Below 327 can retest lows at 311.

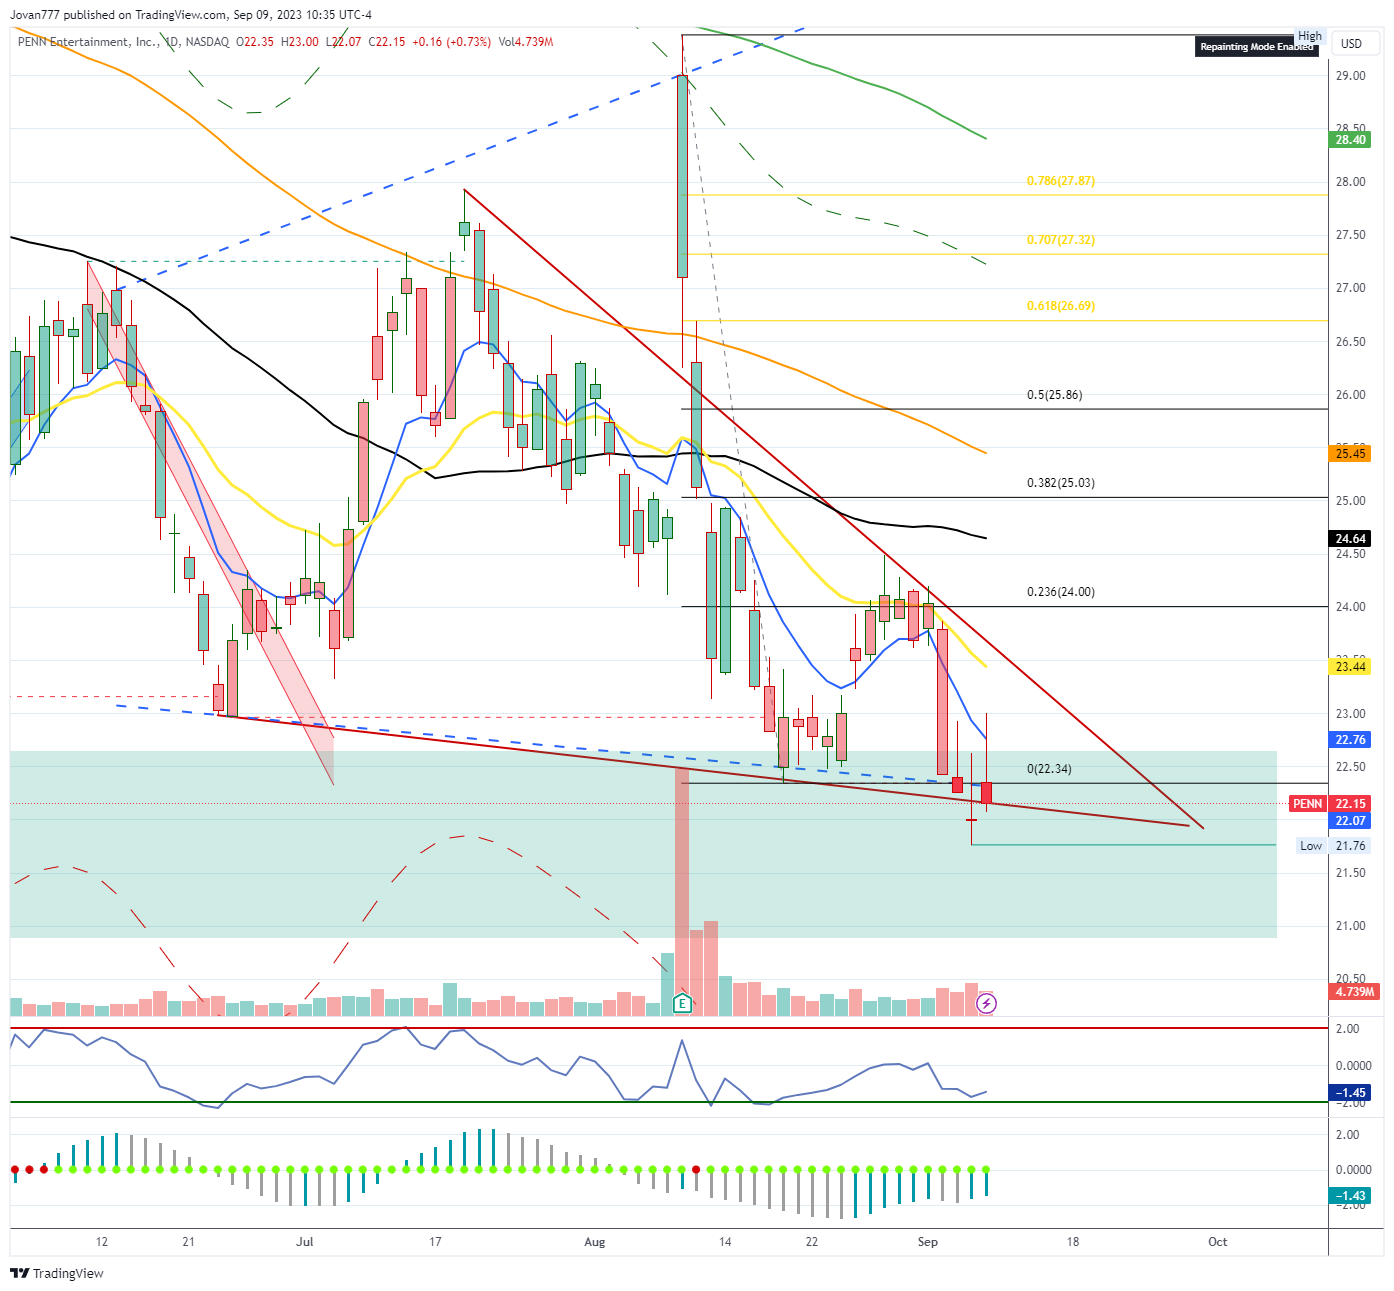
PENN 0.00%↑
Watching this bottom of the wedge and doji it put in on Thursday, if it reclaims 23 it can be staging a breakout in October to $27
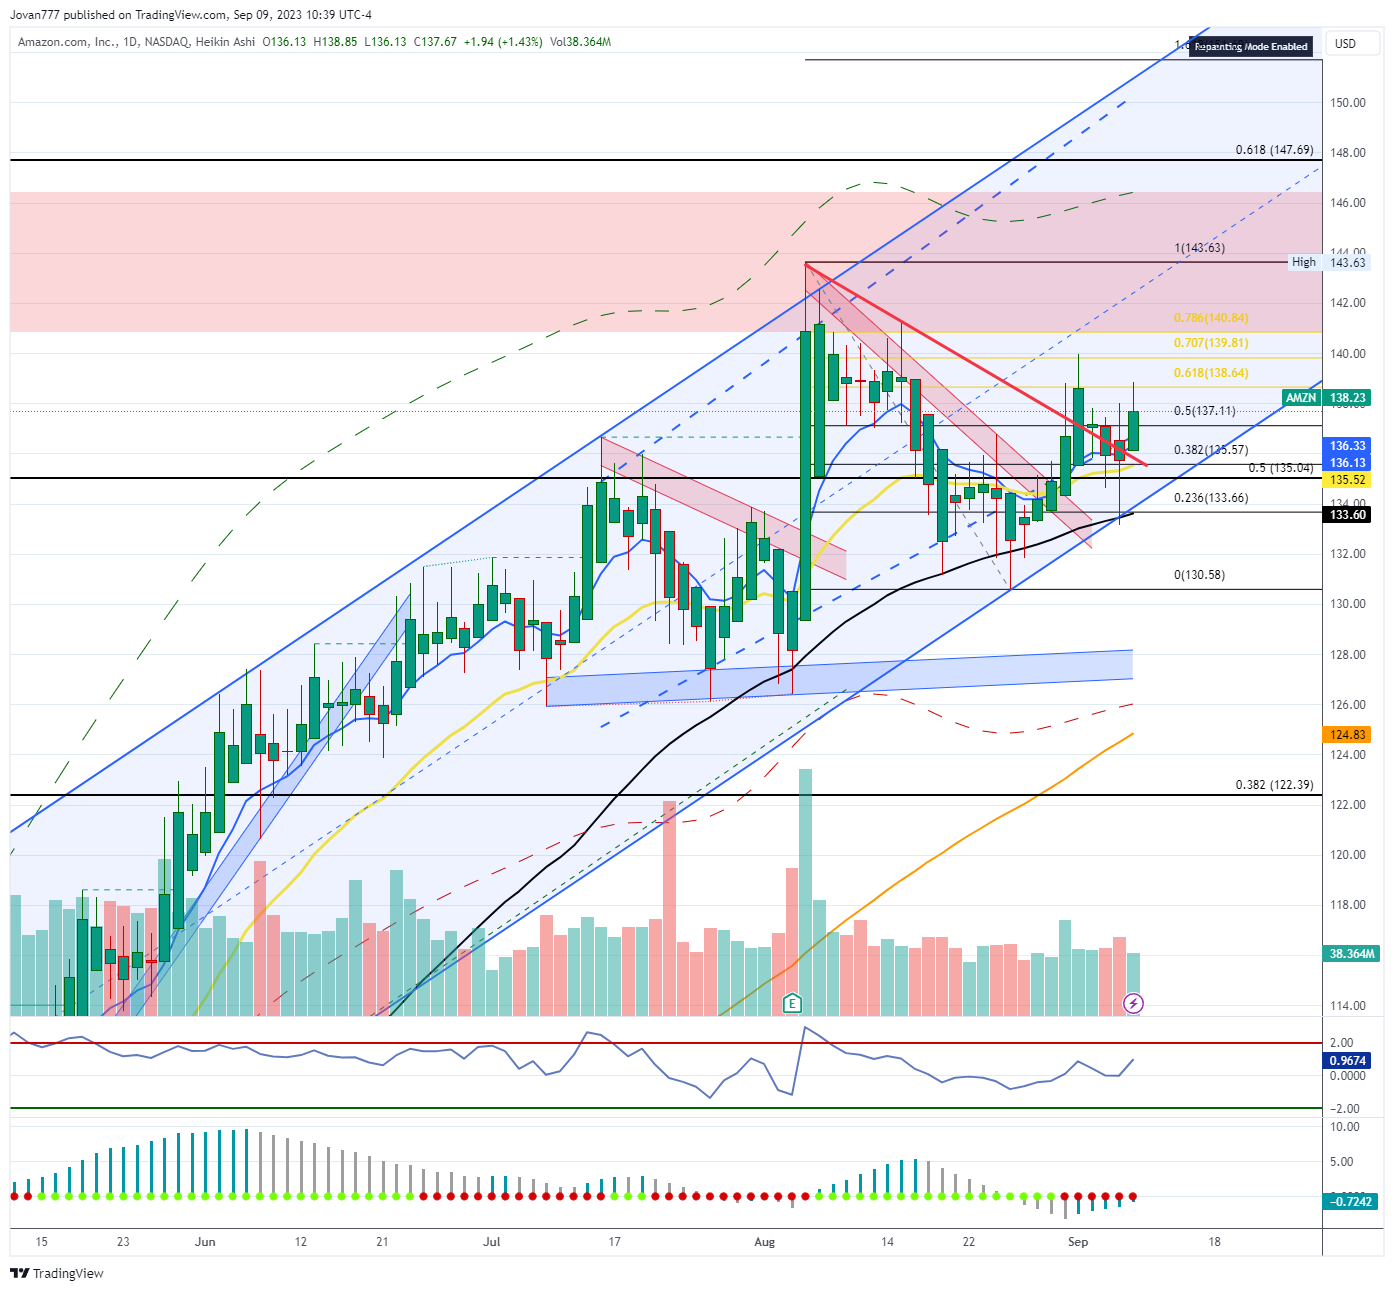
AMZN 0.00%↑
Can see continued move into 140.84, 143.63 and 147.69 as long as 135.57 holds.
ROKU 0.00%↑
Doing the work on the weekly chart
Needs a couple of closes over $85 to get this moving to $100 and $124

Also keeping an eye on TLT 0.00%↑ for a possible “return to safety” trade if SPY fires that bear flag and some sort of event occurs in the 3rd week of September.
Have a wonderful weekend!
Wishing you a successful and profitable trading week ahead!
Best regards, Jovan